How Geotech’s can overcome time crunch: UAV Photogrammetry and 3D LEM Analysis Sponsored
When it comes to open pit mines, generally, the steeper the slopes, the greater the ore extraction, but at what cost to safety? This is an age-old question for geotechnical engineers working in the mining industry.
It’s inevitable that to improve the economics of open pit mine design, slope failures will become a concern. Industry standards can allow for a certain percentage of benches in an open pit to collapse, assuming they are controlled and there’s no risk to personnel. When a slope does fail, it can be a time-consuming process to translate the site investigation data into a geotechnical model for analysis. For situations where production is suspended because of a slope failure, efficient site investigation can be critical to resume operations quickly and reduce the financial impact. Regardless of the situation, back analysis of a slope failure is an important component of open pit mining projects as it can provide insight to help you better understand localized ground conditions and refine your designs for future excavation.
This paper by Bar et al. evaluates a pit slope failure in an iron ore mine in western Australia which was effectively evaluated using UAV photogrammetry and 3D Limit Equilibrium Method (LEM) analysis using Slide3, all of which took less than 12 hours.
Slope Failure
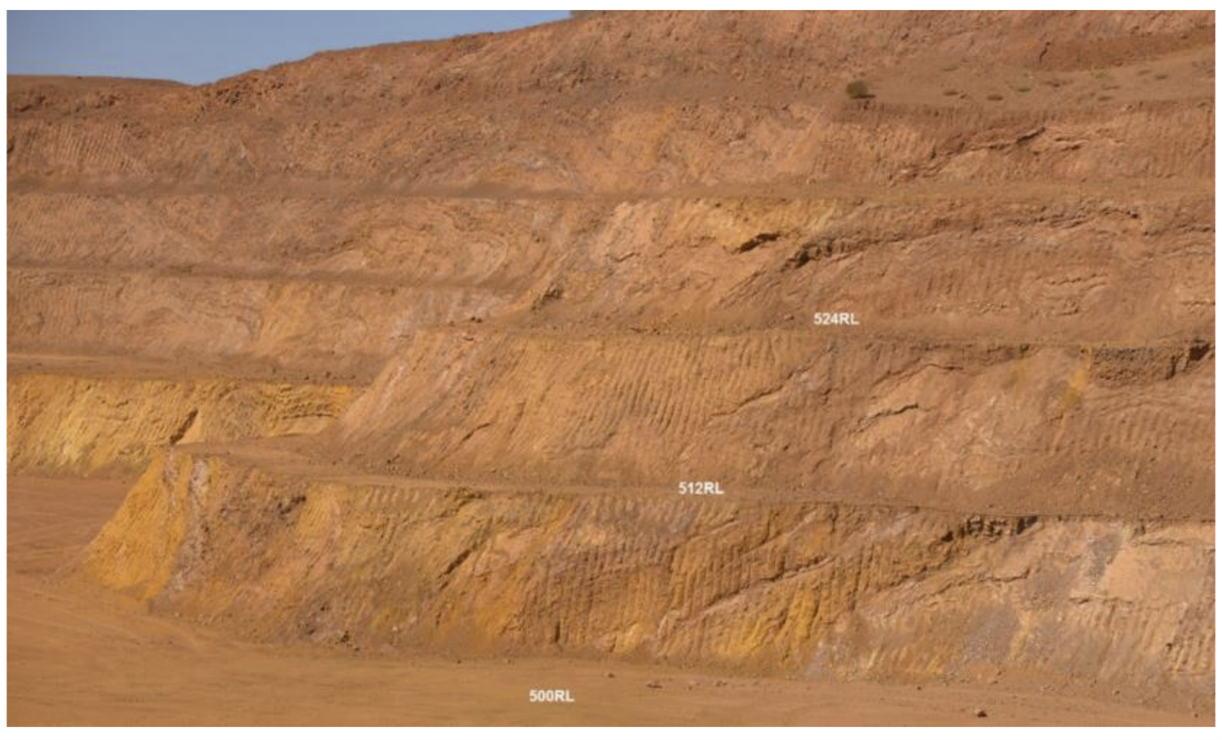
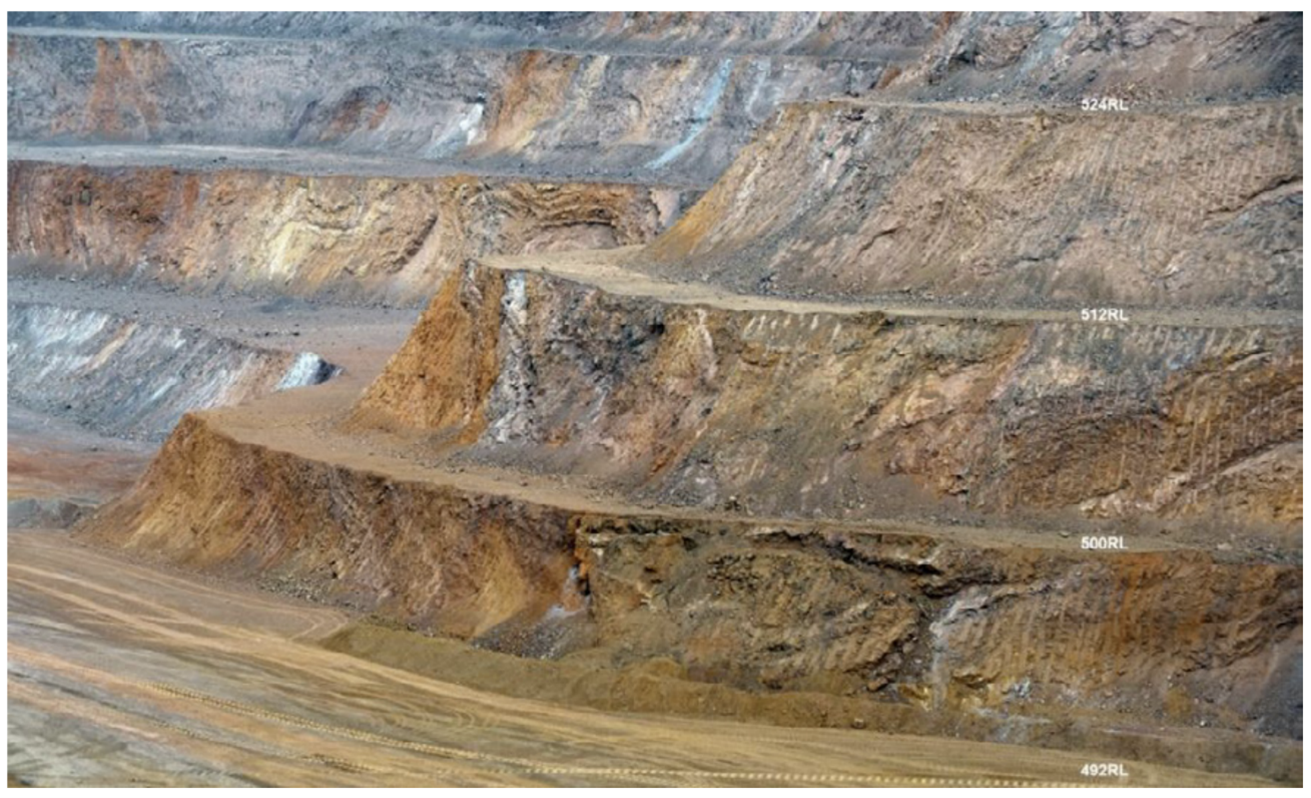
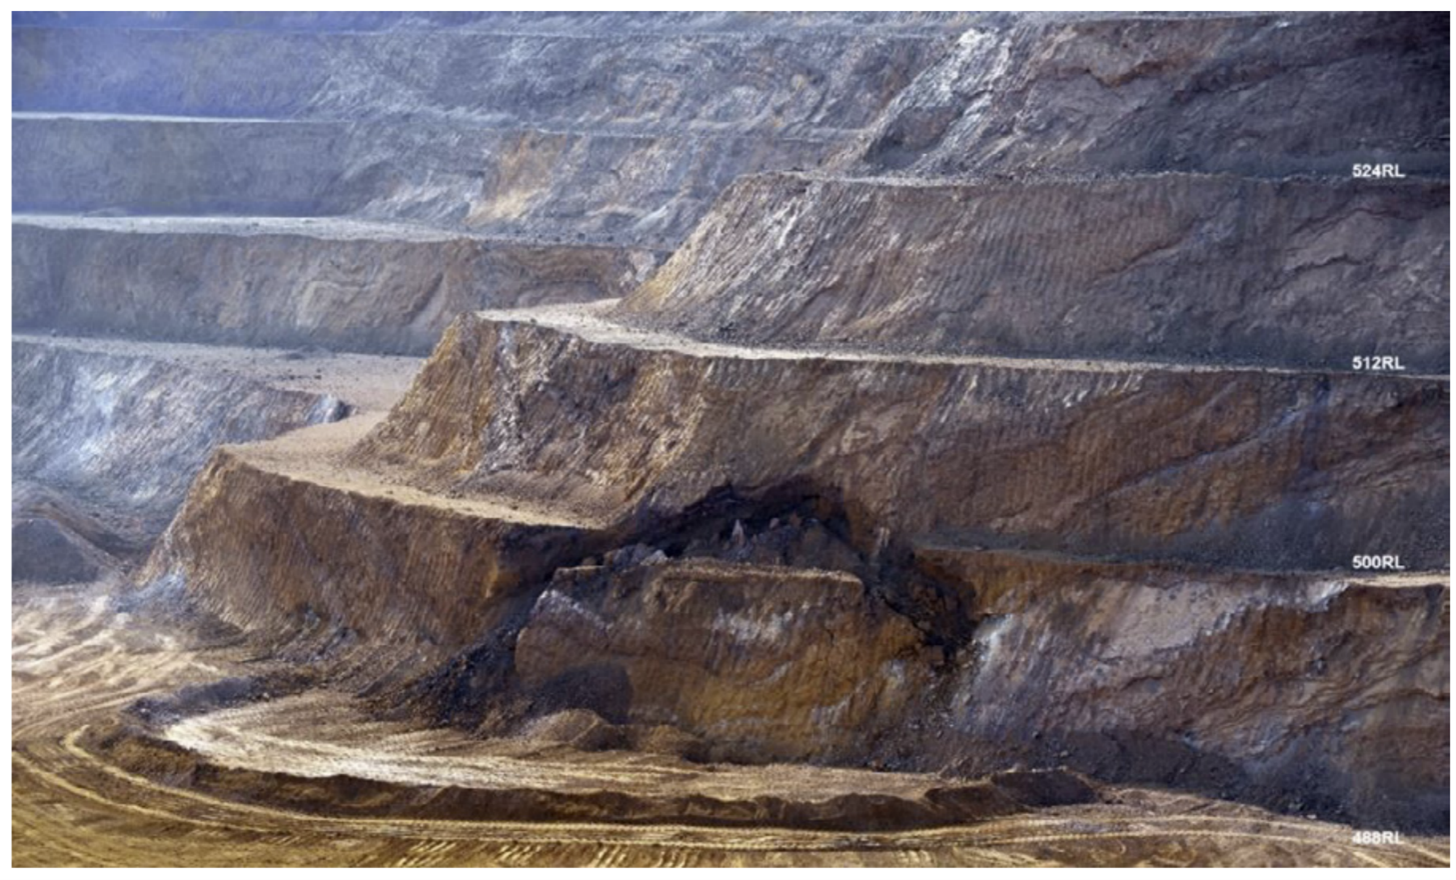
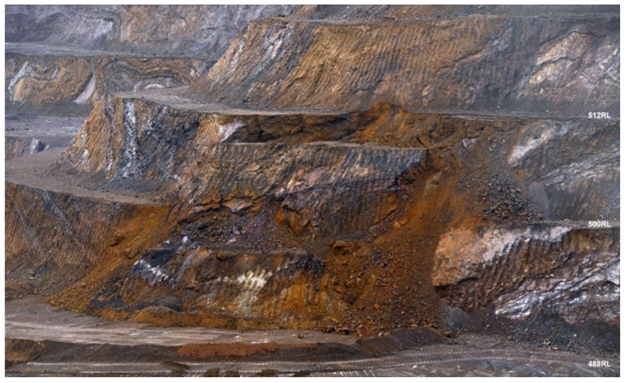
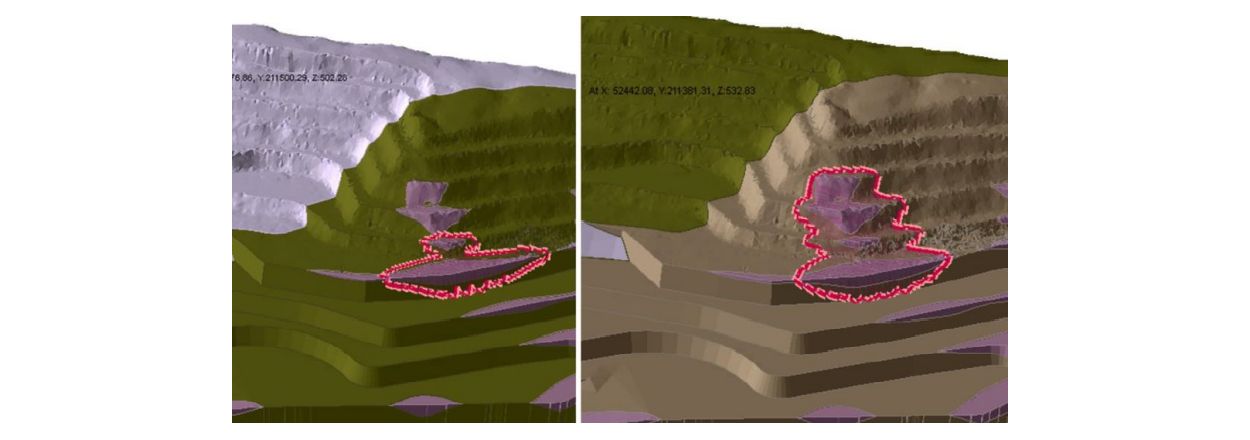
During operations at an iron ore mine in the Pilbara region of Australia, a multi-bench slope failure occurred. The failure was 24m high, 40m wide with a maximum horizontal runout of 5m on the pit floor. The slope failure started as a local bench failure which extended with the progression of excavations which increased loading of the undercut shale band. The failure was controlled by means of a catchment bund implemented in the pre-mining design and no personnel or equipment was damaged. Figures 1-4 show the progression of the failure:
Efficient Geotechnical Model Creation
Back analysis of this slope failure was completed in 12 hours using a combination of UAV photogrammetry and 3D LEM analysis using Slide3.
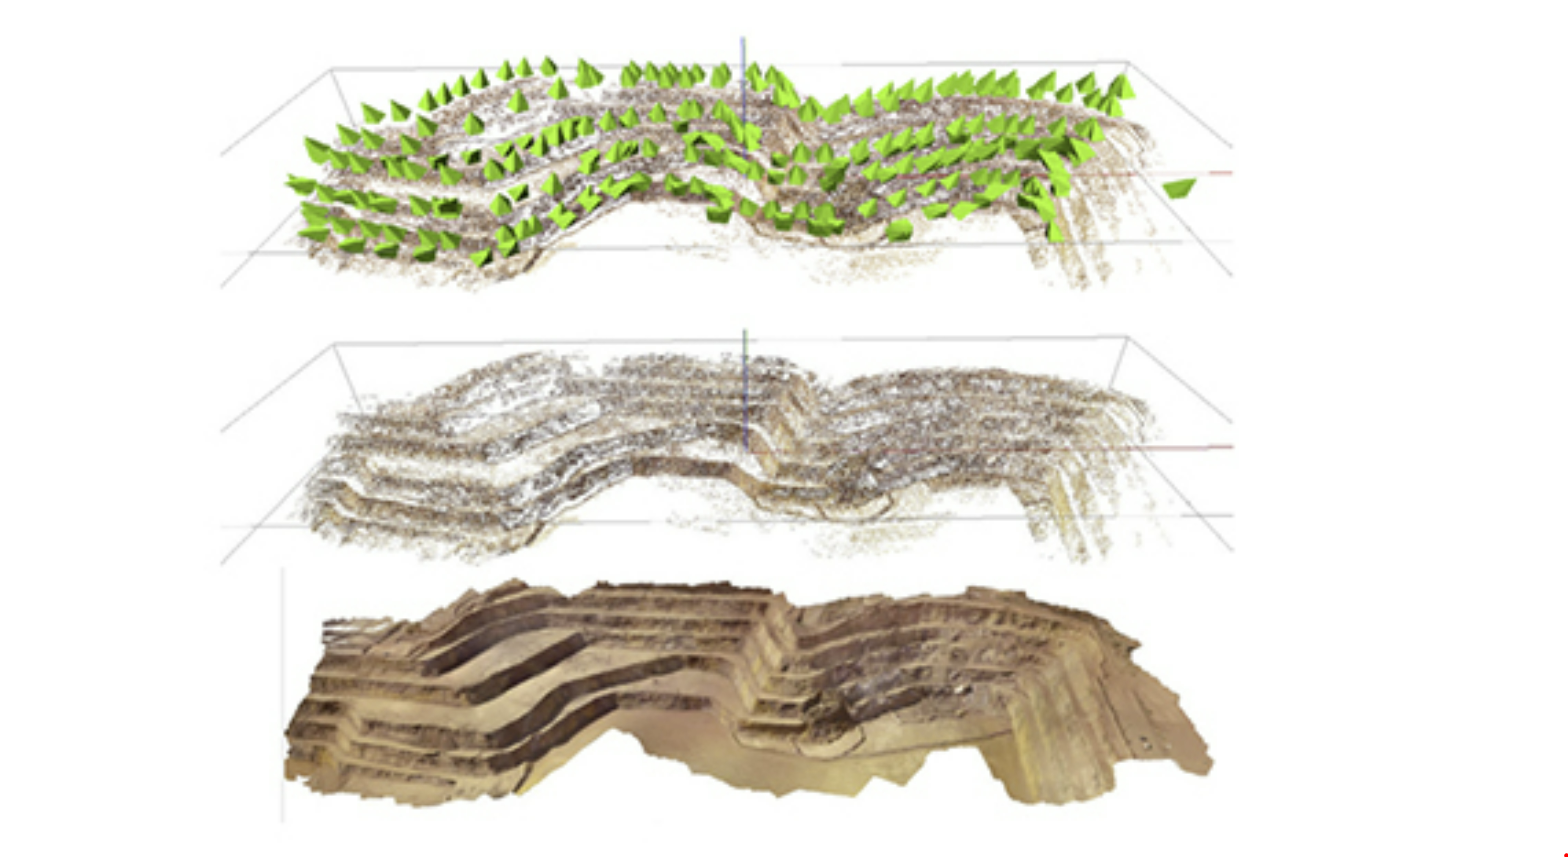
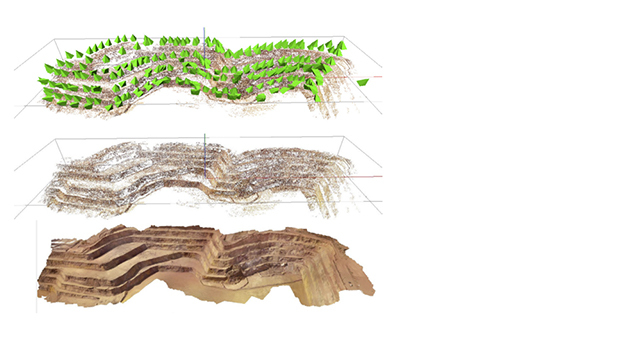
A DJI Phantom 4 drone with a 9 mm camera captured 284 photographs of the slope. Using ShapeMetriX software, the 3D model, consisting of over 7 million surface points, was computed (Figure 5) from the images in less than an hour.
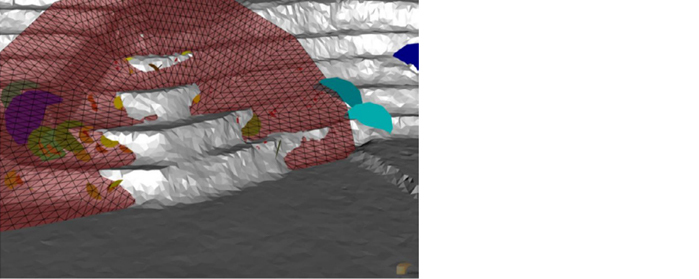
The model was then imported into a 3D CAD program GEM4D where the failure plane was modelled as a 3D surface (Figure 6).
Back Analysis using 3D Limit Equilibrium Method
To better predict future ground behaviour, back analysis was conducted using the location and orientation of the failure plane and 3D stratigraphic wireframes from UAV photogrammetry to refine the original shear strength parameters of the design.
The analysis focused on shale bedding at low confining stress with overburden ranging from 5 to 12 meters. Anisotropic shear strength parameters were adjusted to get a FoS = 1= +/- 0.01 while attaining realistic slip surfaces representative of the failure (Table 1).
Geotechnical Domain | Bedding Strength Properties | FoS | Analysis Method | Failure Volume (m^3) | |
c’ (kPa) | Φ’ (°) | ||||
MacLeod- Newman Contact: Shale | 0 | 29 | 1.002 – 1.026 | Janbu – GLE | 1060 |
0 | 28 | 0.965 – 1.017 | Janbu – GLE | 1070 | |
5 | 26 | 1.009 – 1.077 | Janbu - GLE | 5900 | |
The results suggested bedding shear strengths likely contained 0 to 5 kPa of cohesion with friction angles ranging from 26 to 29 degrees (Figure 7). In addition, vibration and gas pressures from blasting likely resulted in degradation of cohesion which initiated the planar failure.
How can this information be applied?
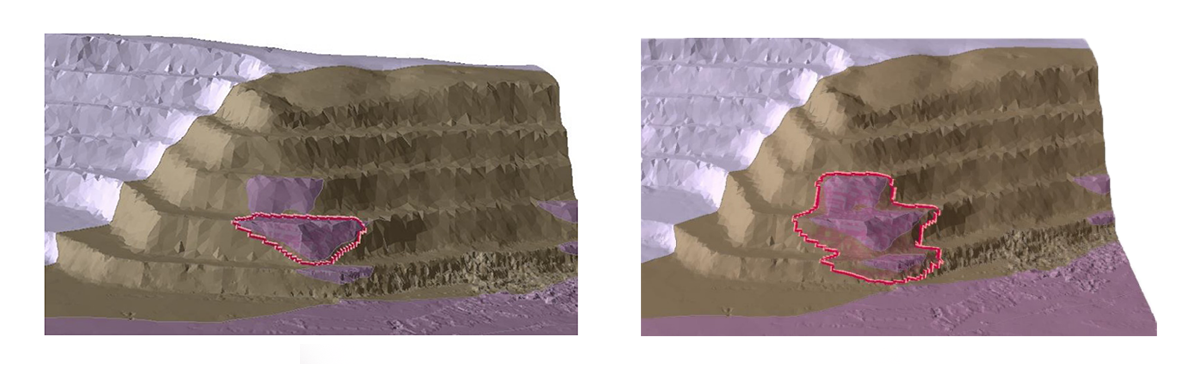
The bedding shear strengths and the updated model wireframes used in the back analysis were used to re-evaluate future pit slope design. Findings from this analysis revealed a FoS of 1.09 for a single bench failure mechanism (Figure 8 - left). Even though this FoS isn’t within the DAC for this project, risk can be effectively managed using wide catchment berms and slope deformation monitoring. In addition, a FoS of 1.20 was calculated for a 48 m multiple bench slope (Figure 8 - right) which was within the DAC. Through analysis with the updated model, no evidence of larger slope failure risks was detected.
What can we learn from this?
In open pit mining projects, as slope failures occur, controlled or unexpected, analysis can be conducted to improve your knowledge of the ground conditions and the accuracy of your models. With the advancements in technology making UAV photogrammetry and 3-Dimensional Slope Stability analysis more efficient, these methods can be effectively carried out in the duration of a geotechnical engineer’s shift.
Sign up for a free trial to learn about Rocscience suite of slope stability software.
Want to read more like this story?

Slide3 and RS2 : The Tools of Choice for Back-Analysis of an Open Pit Mine Highwall Failure
Aug, 29, 2022 | NewsThe Methodology Step 2 – Iterative calibration of the base case model reproduced the observed fail...

Slope Stability: Critical Failure Surface & Design Factor of Safety
Jun, 18, 2021 | EducationCritical Failure Surface As discussed in the previous chapters of the Geoengineer.org series on Slo...

Rocscience | Geotechnical Software for Open Pit Mining
Aug, 22, 2022 | NewsSurface mining, whether you call it open pit, opencast, or open cut is a common method of extractin...

Developing Safe Mine Re-Entry Plans Using RS2: Case Study
Jan, 21, 2021 | NewsDeveloping Safe Mine Re-Entry Plans Using RS2 It would be a perfect world if slope failure didn’t...

2D or 3D LE? That is the Question - Yeager Airport Case Study
Jun, 02, 2021 | NewsWhen is 2D slope stability analysis sufficient and when should 3D analysis be used in conjunction w...

Rocscience | On the comparison of 2D and 3D stability analyses of an anisotropic slope
Jun, 27, 2022 | NewsThe Adoption of 3D Limit Equilibrium Method 2D limit equilibrium analysis is a powerful tool for pr...

Slope Stability Analysis of an Open Pit with Weak Layers, Using RS3 and Slide3
Dec, 09, 2022 | NewsThe Limit Equilibrium Methods (LEMs) and Finite Element Methods (FEMs) are extensively used in slop...

Slope Stability: Example Analysis
Jul, 12, 2021 | EducationSlope Stability Analysis In this chapter of the Geoengineer.org series on Slope Stability, a s...

Column Resolution Impacts on 3D Open Pit Stability
Nov, 02, 2021 | NewsIn this paper, Bentley Systems specialists Marina Trevizolli, Murray Fredlund, and Hai Hua Lu ill...
Form
Looking for more information? Fill in the form and we will contact Rocscience Inc. for you.
On This Day
July 23rd 1972
READ MORE
Related Video

Trending

Lake Chippewa’s floating island that has to be boat-pushed every year

How to Model Piles in PLAXIS

3 Types of Retaining Walls and Revetments


How Do Dams Trigger Earthquakes?
Nepal’s Himalayan settlements face escalating flood and landslide threats