Sinking Cities: The U.S. Subsidence Crisis


Sources: thebrighterside.news, straitstimes.com, cnbc.com, nature.com
Want to read more like this story?

Groundwater extraction causing alarming urban subsidence across India’s megacities
Nov, 04, 2025 | NewsNew research published in Nature Sustainability warns that India’s largest cities are sinking at al...
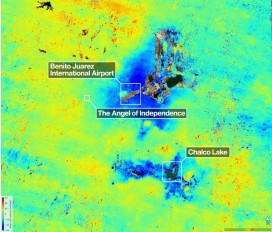
Mexico City’s sinking crisis mapped by next-generation satellite
May, 08, 2026 | NewsMexico City’s long-documented subsidence problem is receiving renewed attention after the NASA-ISRO...

Geo-Mapping the Future: AI-Powered Solutions for Urban Liquefaction Risks
Oct, 08, 2024 | NewsAs cities expand, so does the need for robust disaster management, especially in earthquake-prone a...

California expands groundwater and subsidence monitoring statewide
Oct, 10, 2025 | NewsCalifornia’s Department of Water Resources (DWR) has launched a major expansion of its groundwater...

An active fault zone poses a threat for infrastructure in Salt Lake City, Utah
Jun, 03, 2021 | NewsAccording to a new study, a complex fault system beneath Salt Lake City can pose a severe threat to...

Iran’s heritage sites threatened by accelerating land subsidence, experts warn
Nov, 03, 2025 | NewsCenturies-old monuments across Iran are facing increasing risks from land subsidence driven by deca...

Risk assessment of rainfall-induced landslides in urban regions
Aug, 09, 2021 | NewsA new study suggests that urban areas are more prone to rainfall-induced landslides compared to rur...

Urban areas at greater risk for landslides due to the effects of precipitation
Aug, 09, 2021 | NewsA new study indicates that urbanized areas are more prone to landslides caused by precipitation tha...

The Rising Threat of Groundwater Flooding: Risks and GeoEngineering Solutions
Feb, 28, 2025 | NewsGroundwater flooding is an often-overlooked hazard, but as climate change intensifies, its risks ar...
On This Day
July 20th 1940
READ MORE
Related Video

Trending
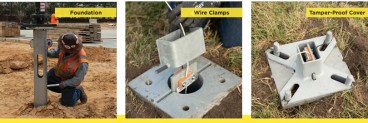
How to prevent copper wire theft from light poles
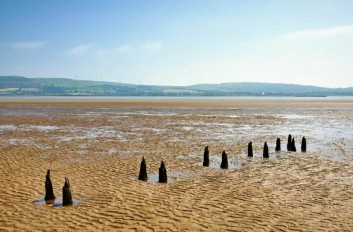
The quicksand of Morecambe Bay

Model Structures and Visualize Structural Forces
Rapid Drawdown in Dam and Levee Design: A Hydrogeologic Perspective in Slide2

Unstable Ground: Lessons from the I-80 New Jersey Sinkhole Saga
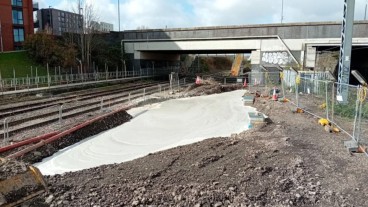
Emergency ground stabilisation protects rail works near Salford Central