Wildfires and Debris/Mudflows
Contents [show]
Introduction
As global temperatures continue to spike, an introduction to extreme weather events has led to an increase in wildfires in the Western United States, and also to an increase in the frequency at which they occur. Wildfires have directly impacted and destroyed segments of my community. The focus of this paper is to understand the debris/ mudflows that follow shortly and long after a wildfire has occurred, where they occur, how we assess them and what mitigation methods exist. The importance of understanding the interrelationship between wildfires and debris/mud flows stems from the detrimental impact they have on soil recovery, infrastructure, and ecosystem damages.
Mechanisms
Pre-Wildfire
In order to understand debris/mudflows, it is important to understand the mechanisms above and below grade prior to and after a wildfire has occurred. Prior to a wildfire, the unburned soils less prone to erosion because they contain a high-water infiltration rate, which significantly reduces the runoff water at the soil surface. Furthermore, the forest canopy and litter layers protect the soil from the erosion power of heavy rainfall by anchoring the soil in place. The litter layers and canopy above grade also work together to reduce the velocity of runoff water. They act as partitions that increase the retention time of precipitated water in a “single” area, thus, allowing the soil to absorb more water. It follows then, that the more cover the less chance of accelerated erosion.
Post-Wildfire
After a wildfire much of the protective forest canopy and litter layers are lost, so susceptibility to erosion is much higher due to lower infiltration rates, flooding, and runoff water velocities increasing during a heavy rainstorm. Primarily, because the “exposure of organic matter in the shallow soil layers to high temperatures produces gasses that make soil grain surfaces hydrophobic” (Movasat and Tomac). Hydrophobicity or “water repellency” reduces the soils ability to absorb water, which not only increases the amount of runoff water at the soil surface, but also, exposes the soil surface to raindrop impact and splash. The reason this is important is because “rain impact and splash can detach soil particles. [Furthermore,] detached clay particles can form a seal (light crust) and keep water from moving into the soil” (Paige and Zygmunt). Runoff storm water and detached soil particles are the perfect recipe for mudflows.
Debris/Mud flow warning signs
There are many warnings associated with the detection of future debris/mud flows. In their publication, “Landslide Preparedness,” USGS science for a changing world bullet points a few warning signs: “Springs, seeps, or saturated ground in areas that have not typically been wet before. New cracks or unusual bulges in the ground, street pavement or sidewalks. Soil moving away from foundations. Broken water lines and other underground utilities. Rapid increase in creek water levels, accompanied by increased turbidity. Sudden decrease in creek water levels though rain is still falling or just recently stopped. Unusual sounds, such as tree crackling or boulders knocking together.” Debris flows are composed of loose material, such a mud, soil, rock, sand and air flowing down a slope by way of gravity. Whereas mudflows are masses of water and sand size particles. The typical landslides that happen after a fire are mudslides since the soil does not absorb surface runoff water.
Landslide types
Landslides are classified as four main types: slides (translational and rotational), flows and creep, fall and toppling. According to Landslides 101 by USGS, “Landslides occur in every state and U.S territory. The Appalachian Mountains, the Rocky Mountains and the Pacific Coastal Ranges and some parts of Alaska and Hawaii. Any area composed of very weak or fractured materials resting on a steep slope can and will likely experience landslides.” After a wildfire burns a slope, the probability that a debris flow occurs increases for the fore-coming years. Even though some landslides require a long duration of rain and saturated slopes, a debris flow can happen on a dry slope shortly after an intense rainfall (rain falling at a rate of 0.5 inch/hr). Specifically, because debris flows are dependent on the rate of rainfall rather than the total amount of rain.
Case Study 1
Although wildfires occur globally, California has been experiencing significant loss due to the wildfires. In 2018, a debris flow caused by the Thomas Fire in Montecito California, ripped through hundreds of millions of dollars in property damage and took twenty-one lives with it (see figure 1). On site investigations of the field conditions post-fire revealed that the entire vegetative cover of the area was lost and that the properties of the soil above grade changed due to the blazing temperatures. There was also an uneven distribution of ash deposits on the ground surface, which resulted in “a reduction in the permeability of the soil and a corresponding increase in run-off water…The exposure to high heat from the wildfire caused a brittle and cracked surface prone to infiltration” (Tiwari). The amount of debris flow that followed after also widened the creek from “2 to 3 m to 20 to 40 m” (Tiwari).
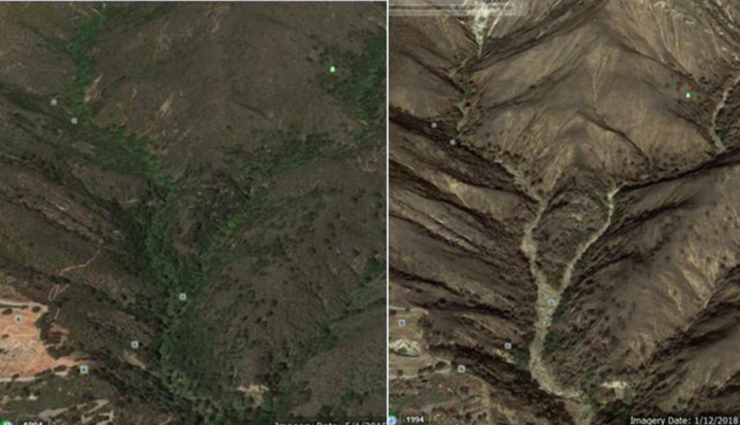 Figure 1. Google Earth imagery of the creek and watershed before (left) the Thomas Wildfire and after (right) the wildfire and Montecito debris flow events (Tiwari).
 Figure 2. Google Earth imagery of the debris accumulation on US Highway 101 (left) and overflown debris basins (right). (Tiwari).
The field investigation team performed sieve tests for two different depths at the creek bank. The soil above grade containing ash deposits and the parental soil below grade. Neither of the collected samples were mixed or combined prior to testing. In addition, boulders and coarse gravel were not included in the test. A sieve analysis (ASTM D6913/6918 M) of the grain size distribution of the parental soil revealed that the “fine contents were approximately 10. Atterberg limit test (ASTM D4318) indicated that the parent soil has a LL of 42% and a PI of 5%. The soils were classified as SP-SM and SW-SM per the USCS classification system” (Tiwari). The grain size distribution can be seen on Figure 3.
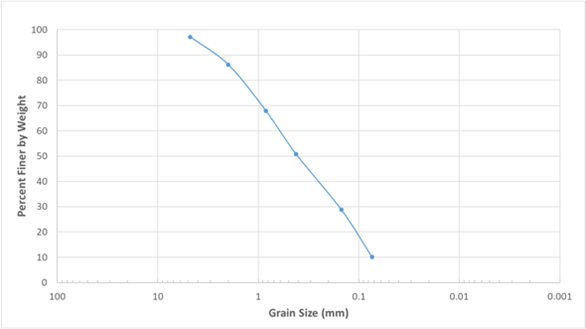 Figure 3. Grain size distribution curves for the collected soil samples (Tiwari).
In order to represent the soil condition following the Thomas wildfire, the field investigation team measured the residual shear strength of two different materials. 1) the original soil, and 2) the ash deposit. “The residual shear strength measurements were conducted at normal stresses of 100, 200, 400 and 800 kPa using a GDS ring shear apparatus. The results, as shown in Figure 4, indicate that the residual shear strength of the ash was less than one third of the original strength of the soil. The extremely low residual shear strength of the ash deposited on the soil matrix indicates that once a slope fails and the debris mass runs over the ash deposit, the debris mass can easily increase in velocity and momentum to move down the slope and travel large distances very quickly” (Tiwari).
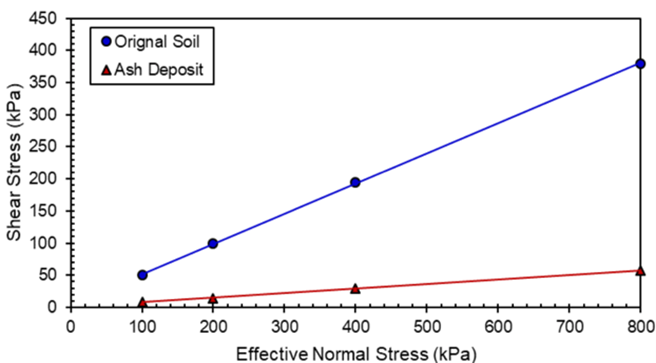 Figure 4. Residual shear strength failure envelopes from ring shear testing on original soil and ash deposit (Tiwari).
Case 1 Conclusion
Key takeaways from the Montecito debris flow disaster are as follows: blazing temperatures not only changed the soil properties and vegetation above grade, they also left an uneven distribution of ash deposits on the ground, which resulted in a lower hydraulic conductive soil. Furthermore, the ash deposits reduced the residual shear strength of the soil by one-third of the original soil strength making the soil much more prone to slope failure after an intense rainfall.
Case Study 2
Case Study 2
In 1995 and 2005, the town of La Conchita, California, was shattered by landslides. In 1995, the slope failure moved about 1,300,000 cubic meters of debris and destroyed about 9 homes. “Prior to the 1995 event, historical records showed several large destructive landslides that affected the town of La Conchita, including the slope failures of 1865, 1889, and 1909” (Pradel). In 2005, the slope failure was primarily the consequence of decisions made after the 1995 failure. The failure mobilized about 200,000 cubic meters of debris, which killed 10 people and damaged 23 residences while destroying over a dozen homes. Although, the events that happened in La Conchita, Ca are not a result of wildfires, the mechanisms and mitigation methods used and discussed are viable in preventing debris/ mudflows for wildfire impacted areas.
|
|
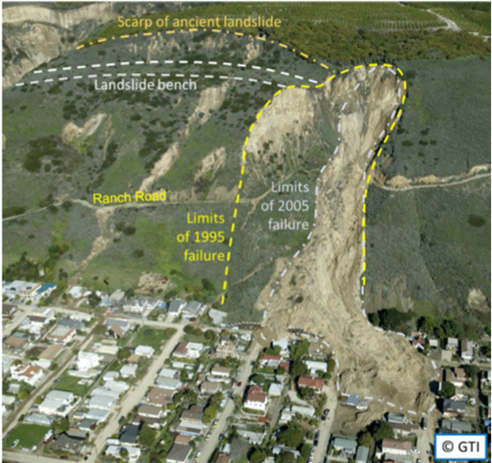
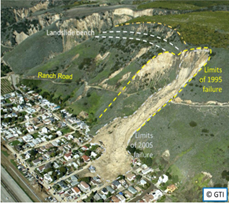
Figure 5. Aerial photographs taken on January 14, 2005 showing the limits of the 1995 and 2005 landslides (Pradel).
Pre-1995 Landslide Investigations
In 1988, geotechnical consultants mapped the area and recommended that the surface drainage, subsurface dewatering, and flattened slopes be improved. This led to the installation of hydraugers on Ranch Road, which crosses the slope diagonally. In 1993, the consultants estimated a factor of safety of 1.1, and recommended that the factory of safety be brought to 1.5 by 1) Further flattening the slopes and, 2) Unloading the slopes. “About 0.7 km south of the town, the slope was benched into natural materials in order to protect the train right-of-way from landslide hazards” (Pradel). Eventually, the road experienced lateral and vertical movements, which called for the drilling of boring samples and the installation of piezometers. The boring samples revealed thick gravel deposits which made the soil prone to seepage flow. The “piezometers installed during this period, generally recorded groundwater within the displaced bedrock and a rise in piezometric head, i.e., rising groundwater above the ancient landslide basal plane. Additionally, the consultants’ surface mapping revealed several new seeps near the toe of the slope during their 1994-95 visits. Except at low elevations the borings did not reveal near surface saturation which is the likely the reason why the 1995 slide moved in classical deep-seated block manner and did not become a debris flow like in 2005” (Pradel).
Post-1995 Landslide Investigations
Following the 1995 slope failure, the stability of the slope became a big concern, this was primarily due to the alarming potential for debris flow and mudflows. Additional boring samples were taken and new measurement instrumentations like tiltmeters, pipeline strain gauges, and slope inclinometers were installed. Various consultants proposed grading the slope to a 2.5:1 ratio (horizontal:vertical) for lower debris and 1.5:1 for upper debris. Furthermore, a winterization plan was proposed, which involved the installation of surface drains and drainage barriers, and the filling of cracks to reroute the drainage to and from the Ranch Road. However, “the Ranch only implemented minimal drainage improvements. To redirect drainage, a dozer carved an unlined drainage ditch diagonally across the slide, that started at the end of Ranch Road on the south side and ended at the toe of slope on the north side. In the middle of the slope, the unlined channel discharged into a depression that formed during the 1995 slope failure; this large depression collected water and became locally known as Anderson’s Lake. Draining surface flow across the slope failure facilitated, through infiltration, the long-term saturation of the mid to lower slide mass” (Pradel). In order to restore traffic along Ranch Road, the county built a nondraining soldier pile and lagging wall, which ultimately created a dam effect due to the buildup of hydrostatic pressures.
Post-2005 Landslide Investigations
According to Daniel Pradel’s, paper, La Conchita Landslide: Case History and Remedial Measures, after the slope failure in 2005, Geotechnical engineers collected a vast amount of data between 2007 and 2009. With this data, they concluded the implementation of four costly mitigation strategies.
- Full Grading ($200M): involves the complete removal of the 1995/2005 landslide mass and partial removal of the ancient landslides by trimming the slope to a more stable angle.
- Setback from hazards ($54M): is an alternative where homes would be removed from the toe of the slope to create a protective setback area. Landslides and debris flows would continue to deposit materials but would not significantly impact the remainder of the town.
- Basins on Coastal plains ($95M): involves the complete removal of the 1995/2005 landslide mass, but only limited grading (i.e., slope flattening) is performed elsewhere on the slope. This alternative proposes the construction of large debris basins within the town to contain material from potential debris flows.
- Basins on coastal plains with reduction of upslope hazard ($56M): is an alternative where the slope is locally flattened by grading in order to reduce debris flow hazards. It also proposes the construction of an embankment in the lower portion of the slope (up to elevation 100 m) where debris can be contained.
With these four mitigations strategies in place it was concluded that the groundwater was likely from isolated water tables within thin highly hydraulic conductive units. In addition, hydraulic conductive terrace deposits were thick enough to create a connection across the fault. Lastly, they believe that the basal plane formed a groundwater path from the terrace sands to the more recent landslide masses.
Case 2 Conclusion
The mitigation measures taken by the consultants prior to the 1995 landslide were very minimal. A mixture of “too many” factors and poor decision-making management ultimately, contributed to the long-term saturation of the 1995 landslide. In addition, incorrect mitigation measures in 2000 like the “construction of [the] retaining wall along the toe of slope created a barrier [for] groundwater flow which resulted in the built-up of hydrostatic pressures” (Pradel) and the 2005 slope failure.
Equations
As a measure of prevention, caution, and analyzation of debris flows due to slope failures, geotechnical engineers use debris flow equations to calculate the shear stresses and velocities in a debris flow. For Shear stresses in debris flow, Professor Neil Humphrey, at the University of Wyoming, “Uses a coordinate system where x is the flow direction (parallel to slope a) and z is in the up direction (perpendicular to slope). The equation for the shear stress at any height z from the base plane of the debris flow, (the stress is on the plane parallel to the surface of the flow, in an approx. uniform flow, in the x direction): Note that z is not vertical, but perpendicular to flow and that z is equal to 0 at the bed, z is equal to the thickness of the viscous layer (D viscous) at the plug/shearing layer boundary and z is equal to the depth of the flow (D total) at the surface. The stress is given by z.” 
Mitigation Methods
To avoid debris/mud flows, studies have been performed to find soil erosion control measures called BAER’s (Burned-Area Emergency Rehabilitation). Some of the common soil erosion control measures discussed in Paige and Zygmunt’s article The Science Behind Wildfire Effects On Water Quality, Erosion include: Reseeding, planting quick growing vegetation in the area so that the dense and fibrous root systems of the plants/grasses anchor the soil down. In addition, it creates longer water retention time above grade, which gives the soil enough time to absorb water. Mulch is also another technique that geotechnical engineers have used to control erosion. Adding mulch to the soil improves the retention of moisture, which in turn, allows vegetation to grow. A secondary control measure used to decrease the streamflow rate in channels and streams involves disrupting the flow rate through the channels by introducing different materials that acts as flow resisters. Resisting the flow of water also allows the channels to store sediments. In a similar fashion, embedding contour logs into the soil allows the water content to build up and thus, allowing the soil to absorb the water. Lastly, silt fencing is also commonly used. Silt fencing essentially traps and removes sediment from runoff water, which decreases the accumulation of material during runoff and hence, reducing the risk of a mudslide. BAER treatments have been shown to be the most effective in reducing post-fire runoff and erosion rates.
Conclusion
As the fight towards climate change mitigations continue, subsets of extreme weather events like wildfires will continue to increase in occurrence until an appropriate controllable measure is found. The detrimental impact that these subsets (catastrophic events) have on the environment goes far beyond the fatalities and financial damage they employ. The aftermath of these events affects our ability to inhabit and populate an area due to the alteration of ecosystems and soil matrix properties. Montecito, Ca and La Conchita ,Ca are just one of hundreds of thousands of populated areas that has been or will be impacted by wildfires and debris/mud flows. It’s clear that the research indicates that the causes and effects of debris/mud flows is multifaceted and cannot be contributed to any one environmental factor. However, with the increasing literature and case studies available, we are able to now predict the occurrence of debris/mud flows with more accuracy than ever before. This provides a sense of hope for the community to be more confident that science is on their side.
Work Cited
Debris flow equations ESP 2012. Humphrey.
http://geofaculty.uwyo.edu/neil/teaching/4880_files/debris.html
Landslides 101 – USGS science for a changing world. https://www.usgs.gov/natural-hazards/landslide-hazards/science/landslides-101?qt science_center_objects=0#qt-science_center_objects
Landslide. https://en.wikipedia.org/wiki/Landslide
Landslides Preparedness – USGS science for a changing world.
Movasat, Mahta, and Ingrid Tomac.“Post-Fire Mudflow Prevention by Biopolymer Treatment of Water Repellent Slopes.” Geo-Congress 2020, 2020, doi:09.28.2020
Paige, Ginger and Jennifer Zygmunt. “The Science Behind Wildfire Effects On Water Quality, Erosion.” Living With Wildfire in Wyoming. doi: 9.28.2020
Pradel, Daniel. “La Conchita Landslide: Case History and Remedial Measures.” Geo-Congress 2019, 2019, doi:10.1061/9780784482070.028.
Tiwari, Binod, et al. “Impact of Wildfire on Triggering Mudslides—A Case Study of 2018 Montecito Debris Flows.” Geo-Congress 2020, 2020, doi:10.1061/9780784482797.005.
 Humberto Castillo
Industry News


Enable true ground-informed design in Civil 3D


Events

19th European Conference on Soil Mechanics and Geotechnical Engineering, Istanbul, Türkiye
The 10th International Congress on Environmental Geotechnics

11th European Conference on Numerical Methods in Geotechnical Engineering

1st International Conference on Sustainability in Geotechnical Engineering (ICSGE 2027)

The 4th International Conference on Press-in Engineering 2027 (ICPE2027)

International Symposium on Cone Penetration Testing (CPT'27)

Rocscience International Conference 2027: Geotechnics, Structures & Hydro in the Age of AI
IS-GI Lyon 2027: International Symposium on Ground Improvement