Standard Penetration Testing (SPT)
Contents [show]
- Introduction
- Driving sequence
- Corrections
- Correlations
- Correlation between standard penetration number N60 and relative density of granular soil Dr
- Correlation between angle of friction φ’ and standard penetration number N60
- Correlation between modulus of elasticity Es and standard penetration number N60
- Correlations for standard penetration number N60 in cohesive soil
- Correlations between CPT and SPT
- Correlations between CRR-values and adjusted N-indices
- Correlations for calculating the ultimate point resistance, qp, of a pile with SPT results in granular soil
- Correlations for calculating the "capacity" of a pile R
- Glossary
- Conclusion
- References
- Gallery
- Media
- Resources
- Selected Topics
Introduction
A standard penetration test (SPT) is one of the most popular in-situ tests carried out worldwide. The test was developed in the United States in the 1920s (Das, 2019).
Standard Penetration Test (SPT) is a simple and low-cost testing procedure widely used in geotechnical investigation to determine the relative density and angle of shearing resistance of cohesionless soils and also the strength of stiff cohesive soils.
Driving sequence
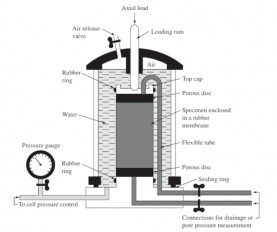
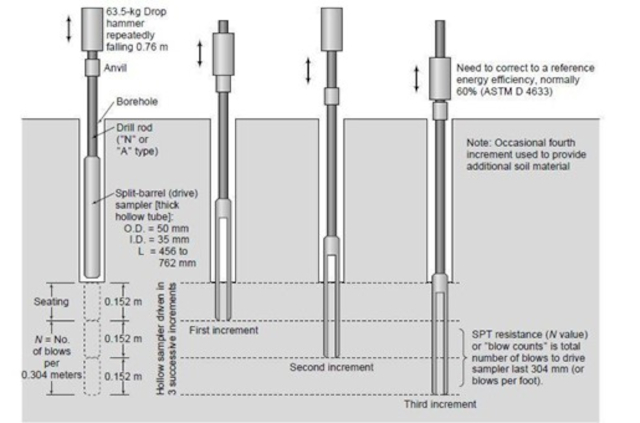
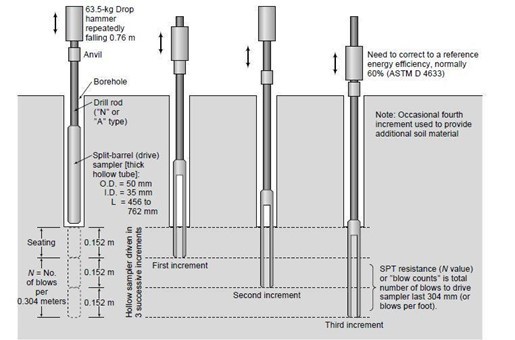
Firstly, a borehole is extended to a predetermined depth. The drill tools are removed, and the sampler is lowered to the bottom of the hole. The sampler is driven into the soil by hammer blows to the top of the drill rod (see Figure 1). The standard weight of the hammer is 63.5 kg (140 lbs), and for each blow, the hammer drops a distance of 760 mm (30 inches).
The number of blows required for a spoon penetration of three consecutive 150 mm (6 inches) intervals is recorded (see Figure 2). The number of blows required to penetrate the first 150 mm is called “seating drive” and the total number of blows required to penetrate the remaining 300 mm depth is known as the “standard penetration resistance”, or otherwise, the “N-value”. If the N-value exceeds 50 then the test is discontinued and is called a “refusal”. The interpreted results, with several corrections, are used to estimate the geotechnical engineering properties of the soil.
The sampler is then withdrawn, and the shoe and coupling are removed. Finally, the soil sample recovered from the tube is placed in a glass bottle and transported to the laboratory.

Sampling is part of a standard penetration test (SPT). The split-spoon sampler is the most common type of sampler that is used in the field. Split-spoon samplers can be used to obtain soil samples that are generally disturbed, but still representative. A section of a standard split-spoon sampler is shown in Figure 3. Figures 3a and b show a split-spoon sampler unassembled before and after sampling (Das, 2019).

Corrections
In the field, the magnitude of the SPT hammer efficiency can vary from 30 to 90%. The standard practice now is to express the N-value to an average energy ratio of 60%, N60.
Also, the SPT hammer efficiency, borehole diameter, sampling method, and rod length contribute to the variation of the standard penetration number N at a given depth for similar soil profiles.
Therefore, the N-value corrected to account for these factors can be written as

where
N60 – standard penetration number, corrected for field conditions
N – measured penetration number
ηH – hammer efficiency (%)
ηB – correction for borehole diameter
ηS – sampler correction
ηR – correction for rod length
Variations of ηH, ηB, ηS, and ηR, based on recommendations by Seed et al. (Seed et al., 1985) and Skempton (Skempton, 1986) are given in Tables 1-4 below.
Table 1. Variations of ηH (Das, 2019)
| Country | Hammer type | Hammer release | ηH (%) |
|---|---|---|---|
| Japan | Donut | Free fall | 78 |
|
| Donut | Rope and pulley | 67 |
| United States | Safety | Rope and pulley | 60 |
|
| Donut | Rope and pulley | 45 |
| Argentina | Donut | Rope and pulley | 45 |
| China | Donut | Free fall | 60 |
|
| Donut | Rope and pulley | 50 |
Table 2. Variations of ηB (Das, 2019)
| Diameter, mm | ηB |
|---|---|
| 60-120 | 1 |
| 150 | 1.05 |
| 200 | 1.15 |
Table 3. Variations of ηS (Das, 2019)
| Variable | ηS |
|---|---|
| Standard sampler | 1 |
| With liner for dense sand and clay | 0.8 |
| With liner for loose sand | 0.9 |
Table 4. Variations of ηR (Das, 2019)
| Rod length, m | ηR |
|---|---|
| >10 | 1.0 |
| 6-10 | 0.95 |
| 4-6 | 0.85 |
| 0-4 | 0.75 |
Correction for N60 in granular soil
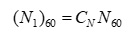
The value of N60 obtained from field exploration under different effective overburden pressures should be changed to correspond to a standard value of σ’0. That is,
where
(N1)60 – value of N60 corrected to a standard value of σ’0 = pa (pa ≈ 100 kN/m2)
CN – correction factor
N60 – value of N obtained from field exploration
A number of empirical relations were proposed for CN in the past.
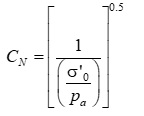
Liao and Whitman’s relationship (Liao and Whitman, 1986):
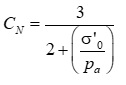
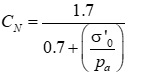
Skempton’s relationship (Skempton, 1986):
- for normally consolidated fine sand

- for normally consolidated coarse sand
- for overconsolidated sand
Seed et al.’s relationship (Seed et al., 1975):

Correlations
Correlation between standard penetration number N60 and relative density of granular soil Dr
Marcuson and Bieganousky (Marcuson and Bieganousky, 1977), Kulhawy and Mayne (Kulhawy and Mayne, 1990):
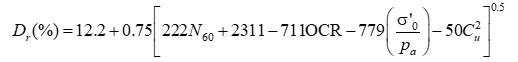
where
Dr – relative density
σ’0 – effective overburden pressure
Cu – uniformity coefficient of sand
OCR = preconsolidation pressure, σ’c / effective overburden pressure, σ’0
pa – atmospheric pressure
Cubrinovski and Ishihara (Cubrinovski and Ishihara, 1999):
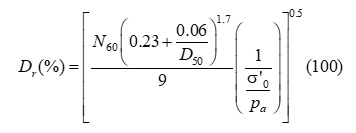
where
N60 – standard penetration number
D50 – sieve size through which 50% of the soil will pass (mm)
σ’0 – effective overburden pressure
pa – atmospheric pressure (pa ≈ 100 kN/m2)
Kulhawy and Mayne (Kulhawy and Mayne, 1990):
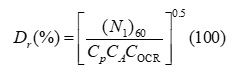
where
(N1)60 – value of N60 corrected to a standard value of σ’0 = pa (pa ≈ 100 kN/m2)
CP – grain-size correlations factor, CP = 60 + 25 log D50
CA – correlation factor for aging, CA = 1.2 + 0.05 log (t/100)
COCR – correlation factor for overconsolidation, COCR = OCR0.18
D50 – diameter through which 50% soil will pass through (mm)
t – age of soil since deposition (years)
OCR – overconsolidation ratio
Correlation between angle of friction φ’ and standard penetration number N60
Peck et al. (Peck et al., 1974), Wolff (Wolff, 1989):
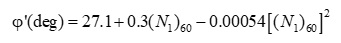
where
(N1)60 – value of N60 corrected to a standard value of σ’0 = pa (pa ≈ 100 kN/m2)
φ’ – soil friction angle
Schmertmann (Schmertmann, 1975), Kulhawy and Mayne (Kulhawy and Mayne, 1990):
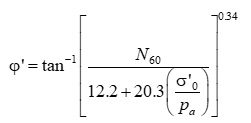
where
N60 – field standard penetration number
σ’0 – effective overburden pressure
pa – atmospheric pressure in the same unit as σ’0
φ’ – soil friction angle
Correlation between modulus of elasticity Es and standard penetration number N60
Kulhawy and Mayne (Kulhawy and Mayne, 1990):

where
pa – atmospheric pressure
α – α = 5 for sands with fines, α = 10 for clean normally consolidated sand, α = 15 for clean overconsolidated sand
N60 – standard penetration number
Correlations for standard penetration number N60 in cohesive soil
The approximate correlation among the consistency index (CI), N60, and the unconfined compression strength (qu) is given in Table 5.
Table 5. Approximate correlation among CI, N60, and qu (Das, 2019)
| Standard penetration | Consistency | CI | Unconfined compression |
|---|---|---|---|
| <2 | Very soft | <0.5 | <25 |
| 2-8 | Soft to medium | 0.5-0.75 | 25-100 |
| 8-15 | Stiff | 0.75-1.0 | 100-200 |
| 15-30 | Very stiff | 1.0-1.5 | 200-400 |
| >30 | Hard | >1.5 | >400 |
Correlations between CPT and SPT

Correlations between CRR-values and adjusted N-indices

Correlations for calculating the ultimate point resistance, qp, of a pile with SPT results in granular soil
Meyerhof (Meyerhof, 1976):
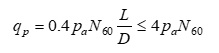
where
pa – atmospheric pressure (pa ≈ 100 kN/m2)
N60 – the average value of the standard penetration number near the pile point (about 10D above to 4D below the pile point)
L – the actual embedment length of the pile
D – the width of the pile
Briaud et al. (Briaud et al., 1985):
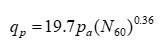
where
pa – atmospheric pressure (pa ≈ 100 kN/m2)
N60 – the average value of the standard penetration number near the pile point (about 10D above to 4D below the pile point)
Correlations for calculating the "capacity" of a pile R
Meyerhof (Meyerhof, 1976):
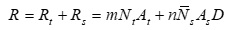
where
Rt – total toe resistance
Rs – total shaft resistance
m – a toe coefficient: m = 400 kN/m2 or 8 ksf – for driven piles, 120 kN/m2 or 2.4 ksf – for bored piles
n – a shaft coefficient: n = 2 kN/m2 or 0.04 ksf – for driven piles, 1 kN/m2 or 0.02 ksf – for bored piles
Nt – N-index at the pile toe (taken as a pure number)
At – pile toe area
As – unit shaft area; circumferential area
D – embedment depth
Decourt (Decourt, 1989, 1995):
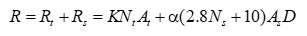
where
Rt – total toe resistance
Rs – total shaft resistance
K – a toe coefficient per soil type and construction method as listed in Table 6
α – a shaft coefficient per soil type and construction method as listed in Table 7
Nt – N-index at the pile toe (taken as a pure number)
Ns – N-index average along the pile shaft (taken as a pure number)
At – pile toe area
As – unit shaft area; circumferential area
D – embedment depth
Table 6. Toe Coefficient K (Decourt 1989; 1995)
| Soil Type | Displacement piles | Non-Displacement piles |
|---|---|---|
| Sand | 325·103 | 165·103 |
| Sandy Silt | 205·103 | 115·103 |
| Clayey Silt | 165·103 | 100·103 |
| Clay | 100·103 | 80·103 |
Table 7. Shaft Coefficient α (Decourt 1989; 1995)
| Soil Type | Displacement piles | Non-Displacement piles |
|---|---|---|
| Sand | 1·103 | 0.6·103 |
| Sandy Silt | 1·103 | 0.5·103 |
| Clayey Silt | 1·103 | 1·103 |
| Clay | 1·103 | 1·103 |
Glossary
Standard penetration test (SPT) N-value – the number of hammer blows required to drive a drill rod with an attached soil sampler 300 mm or 12 inches into soil (or weak rock); this N-value yields information on the geotechnical engineering properties of the soil (Jackson, 2019).
Conclusion
Standard Penetration Test (SPT) is a simple and low-cost testing procedure widely used in geotechnical investigation. The interpreted results, with several corrections, are used to estimate the geotechnical engineering properties of the soil such as the relative density and angle of shearing resistance of cohesionless soils and also the strength of stiff cohesive soils.
For many years, the N-value of standard penetration test has been used to calculate "capacity" of piles. However, the standard penetration test (SPT) is a subjective and highly variable test. These days, N-value are usually adjusted to the N60-value. Several additional adjustments have also been proposed.
The test and the N-value have substantial qualitative value for the experienced geotechnical engineer, but should be used only very cautiously for quantitative analysis. Indeed, using the N-index numerically in formulae is unsafe and imprudent unless used with correlation to prior experience from not just the same geology but also the same site (Fellenius, 2023).
References
Briaud, J. L., Tucker, L., Lytton, R. L., and Coyle, H. M. (1985). Behavior of Piles and Pile Groups, Report No. FHWA/RD-83/038, Federal Highway Administration, Washington, DC.
Cubrinovski, M. and Ishihara, K. (1999). Empirical Correlations between SPT N-Values and Relative Density for Sandy Soil, Soil and Foundations, Vol. 39, No. 5, pp. 61–92.
Das, B. M., Sivakugan, N. (2019). Principles of Foundation Engineering, IXth ed., Cengage Learning Inc., Boston, MA, USA.
Decourt, L. (1989). The Standard Penetration Test. State-of-the-Art report. A.A. Balkema, Proc. of 12th International Conference on Soil Mechanics and Foundation Engineering, Rio de Janiero, Brazil, August 13-18, Vol. 4, pp. 2405-2416.
Decourt, L. (1995). Prediction of load-settlement relationships for foundations on the basis of the SPT. Proc. of the Conf. in honor of Leonardo Zeevaert, Mexico City, Oct. 28-Nov. 6, pp. 87-103.
Fellenius, B. H. (2023). Basics of foundation design, Electronic Edition, Available at: https://www.fellenius.net/.
Jackson, R. E. (2019). Earth Science for Civil and Environmental Engineers, Cambridge University Press, Cambridge, UK. https://doi.org/10.1017/9781139046336
Kulhawy, F. H. and Mayne, P. W. (1990). Manual on Estimating Soil Properties for Foundation Design, Electric Power Research Institute, Palo Alto, CA.
Liao, S. S. C. and Whitman, R. V. (1986). Overburden Correction Factors for SPT in Sand, Journal of Geotechnical Engineering, American Society of Civil Engineers, Vol. 112, No. 3, pp. 373–377.
Marcuson, W. F. III, and Bieganousky, W. A. (1977). SPT and Relative Density in Coarse Sands, Journal of Geotechnical Engineering Division, American Society of Civil Engineers, Vol. 103, No. 11, pp. 1295–1309.
Meyerhof, G. G. (1976). Bearing Capacity and Settlement of Pile Foundations, Journal of the Geotechnical Engineering Division, American Society of Civil Engineers, Vol. 102, No. GT3, pp. 197–228.
Peck, R. B., Hanson, W. E., and Thornburn, T. H. (1974). Foundation Engineering, 2nd ed., John Wiley & Sons, New York.
Robertson, P. K. and Campanella, R.G. (1983). Interpretation of cone penetrometer tests, Part I sand and Part II clay. Canadian Geotechnical Journal, (20)4, pp. 718-745.
Schmertmann, J. H. (1975). Measurement of In Situ Shear Strength, Proceedings, Specialty Conference on In Situ Measurement of Soil Properties, ASCE, Vol. 2, pp. 57–138.
Seed, H. B., Tokimatsu, K., Harder, L. F., and Chung, R. M. (1985). Influence of SPT Procedures in Soil Liquefaction Resistance Evaluations, Journal of Geotechnical Engineering, ASCE, Vol. 111, No. 12, pp. 1425–1445.
Skempton, A. W. (1986). Standard Penetration Test Procedures and the Effect in Sands of Overburden Pressure, Relative Density, Particle Size, Aging and Overconsolidation, Geotechnique, Vol. 36, No. 3, pp. 425–447.
Seed, H. B., Arango, I., and Chan, C. K. (1975). Evaluation of Soil Liquefaction Potential during Earthquakes, Report No. EERC 75-28, Earthquake Engineering Research Center, University of California, Berkeley.
Wolff, T. F. (1989). Pile Capacity Prediction Using Parameter Functions, in Predicted and Observed Axial Behavior of Piles, Results of a Pile Prediction Symposium, sponsored by the Geotechnical Engineering Division, ASCE, Evanston, IL, June, 1989, ASCE Geotechnical Special Publication No. 23, pp. 96–106.
Youd, T. L., Idriss, I. M, Andrus, R. D., Arango, I., Castro, G., Christian, J. T., Dobry, R., Finn, W. D. L., Harder, L. F., Hynes, M. E., Ishihara, K., Koester, J. P., Liao, S. S. C., Marcuson, W. F., Martin, G. R., Mitchell, J. K., Moriwaki, Y., Power, M. S., Robertson, P. K., Seed, R. B., Stokoe, K. H. (2001). Liquefaction resistance of soils: Summary report from the 1996 NCEER and 1998 NCEER/NSF Workshops on evaluation of liquefaction resistance of soils, ASCE Journal of Geotechnical and Geoenvironmental Engineering, 127(4), pp. 297–313.
Image Gallery


Media
Educational Resources
- Standard Penetration Test (SPT) Credits: Geo-Institute Engineering Geology and Site Characterization Committee
Prepared by: Paul W. Mayne, Georgia Institute of Technology, 2016
Selected Topics
Want to read more like this?

CPT Interpretation: Soil Parameters N60, γ, su
Sep, 30, 2024 | EducationAcknowledgement: This page has been reproduced from P. K. Robertson, K. Cabal, Guide to Cone Penet...

Bearing Capacity of Pile Foundations: Calculation Methods for Qs
May, 28, 2024 | EducationIn this third, and last, article about pile foundations’ load-bearing capacity, we are going to...

Bearing Capacity of Pile Foundations: Calculation Methods for Qp
May, 23, 2024 | EducationFollowing the previous section that explained the general background and universal equations...

VertekCPT: Want to clarify the relation between SPT & CPT?
Apr, 21, 2015 | NewsTo determine the mechanical properties of soil, an engineer can rely on both CPT and SPT methods. L...
Shallow Foundation Design
Sep, 09, 2024 | EducationIn foundation engineering, there are two main modes of failure that the engineer needs to design a...

Using Terzaghi’s Equation in Foundation Design
Nov, 25, 2022 | NewsTheoretical models to predict the capacity of helical piles are based on Soil Mechanics and an appr...

SPTfoundation
Sep, 30, 2013 | Software
SPT: Standard Penetration Test Energy Calibration
Apr, 11, 2018 | NewsSPT Energy Calibration consists of measuring the energy transferred by the Standard Penetration Tes...

CPT Interpretation: Soil Parameters OCR, Dr, ψ
Oct, 06, 2024 | EducationAcknowledgement: This page has been reproduced from P. K. Robertson, K.Cabal, Guide to Cone Penetr...
On This Day
June 25th 2022
READ MORE
Trending

Point Load Test

Slope Stability: The Bishop Method of Slices
Angle of Internal Friction

Slope Stability: Introduction to the Method of Slices

Exploring the World’s 10 Tallest Dams

Splitting Tensile Strength Test (Brazilian)
7.5. Example Problems