Pore-Water Pressure Definition for a Levee Stability Analysis Sponsored

This example explores the effect of a flood event on the stability of a levee underlain by a confined aquifer. The analysis is conducted from the perspective of users with different licensing options:
- Bundled licenses,
- Individual license, and
- Individual license with a complimentary basic license (new to GeoStudio 2018).
The main difference between these licensing options lies in the means available for describing the pore-water pressure response within the levee and its foundation. In the case of users with bundled licenses, the pore-water pressure response can be obtained from a transient finite element SEEP/W analysis. Users with an individual license, on the other hand, are constrained to using piezometric lines unless they make use of the complementary basic license introduced in GeoStudio 2018, which allows them to use the results from a steady-state finite element SEEP/W analysis. A comparison of the results highlights the limitations of using piezometric lines to define pore-water pressure conditions, particularly for complex hydrogeological systems. The comparison also reveals that a reasonable approximation of the flow system by means of piezometric lines requires significant insight into the pore-water pressure response.
The three modelling scenarios are referred to as ‘Using Bundled Licenses’, ‘Using an Individual License’, and ‘Using an Individual License with a Basic License’. The first scenario naturally requires a Bundled License that comprises the full-featured functionality of SLOPE/W and SEEP/W (e.g. Standard, Professional, or Universal) because a transient seepage analysis is being completed. The second scenario requires an individual SLOPE/W license to conduct the two piezometric line analysis. The last scenario could be completed using an individual product license for any product (e.g. TEMP/W) because both the SLOPE/W and SEEP/W steady-state analyses comply with the requirements of the Basic license. The limitations of the Basic license can be found on the GEOSLOPE website.
Numerical Simulation
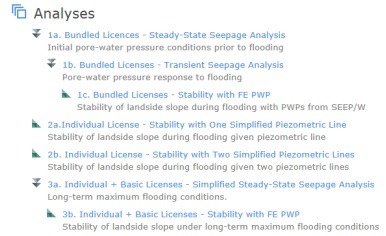
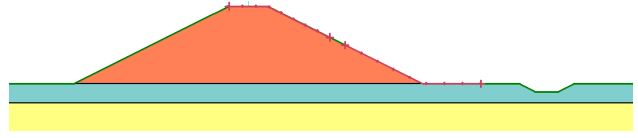
The levee cross-section has a crown width of 10 ft and a side slope of 1:2 (Figure 1). The levee is constructed of compacted clay and overlies a confined flow system. The confined flow system comprises a 5-foot thick, surficial, silty clay layer overlying a sandy aquifer. The lateral extent of the domain is relatively large so that the left and right-hand side boundaries do not influence the pore-water pressure response under the levee. The project analysis tree is presented in Figure 2.

Using Bundled Licenses
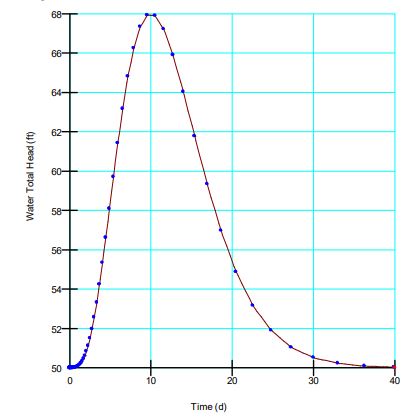
Bundled licenses allow users to work with one, two, or all the products on that license. More importantly, a bundled license comprising SEEP/W allows access to the program full functionality, specifically a transient seepage analysis. As such, they are ideal for conducting integrated analyses involving a greater degree of rigor. In this scenario, the pore-water pressure conditions before flooding were established with a steady-state SEEP/W analysis. A total head of 50 ft was applied to the ground surface on the left-hand side of the levee (i.e. on the riverside) and a potential seepage face was applied to the landside. A transient SEEP/W analysis was then used to simulate the pore-water pressure response during a 40-day flood event. The flood event was defined by a standard dimensionless unit hydrograph:
where h is the river level, ho is the initial river level, hp is the peak river level, and M is a shape factor. t is the time, to is the time at the onset of the flooding event, and tp is the time to the peak river level. Equation 1 can be rearranged to obtain the river level at any point in time in terms of total head, h(t), given assumed or measured attributes of a flood event. In this example, the initial river level was set at the elevation of the floodplain (50 ft), and the river level was assumed to peak at 68 ft (2 ft below the levee crest) at a time of 10 days. The shape factor was set equal to 3.94. Figure 3 shows the resulting total head versus time function that was used as the boundary condition on the floodplain and riverside slope of the levee. A seepage face boundary condition was applied to the ground surface on the landside of the domain.
The Saturated/Unsaturated Material Model was used to characterize the hydraulic properties of all three materials. The volumetric water content and hydraulic conductivity functions were defined using the values listed in Table 1.

The stability of the landside slope of the levee was evaluated with the Morgenstern-Price limit equilibrium method using the entry and exit specifications shown in Figure 4. The Mohr-Coulomb Material Model was used to characterize the strength of all three materials using the properties listed in Table 1.
Using an Individual License
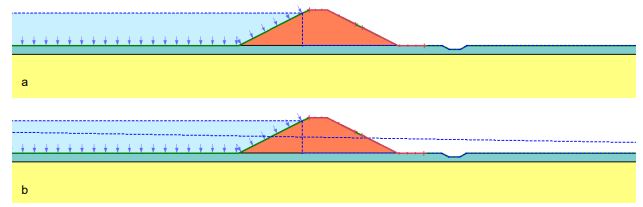
Individual license users, who are perhaps unaware of the complimentary basic license introduced with GeoStudio 2018, often revert to using piezometric lines to describe the pore-water pressure distribution. Two pore-water pressure definitions using piezometric lines are considered. The first definition is a rudimentary simplification of the flow system and uses a single piezometric line that characterizes the pore-water pressures in the levee, confining unit, and aquifer (refer to Figure 5a). The second definition is a slightly better representation of the flow system and uses two piezometric lines. The first piezometric line characterizes the pore-water pressures in the levee and the confining unit, or blanket, whereas the second piezometric line characterizes the pore-water pressures in the confined aquifer (refer to Figure 5b). Based on blanket theory, the pore-water pressure in the aquifer is assumed to decrease linearly from the left to the right-hand side boundary (U.S. Army Corps of Engineers, 1992).
Using an Individual License with a Basic License
As of the release of GeoStudio 2018, a full featured license, either Individual or Bundled, grants access to a Basic License that provides access to the basic functionality of all other products. Among other restrictions, users are limited to two (2) analyses per file, and steady state seepage analyses with a maximum of 500 elements. The use of a Basic License allows the pore-water pressure to be defined using a steady-state seepage analysis assuming it can reasonably describe the pore-water pressure conditions of the complex hydrogeological system. The only simplification required to complete the steady-state analysis is the assumption of a constant peak river level on the riverside of the levee.
Results and Discussion
Using Bundled Licenses
Figure 6 shows the pore-water pressure contours, phreatic surface, and flow vectors generated by the transient seepage analysis at the peak river level. Even though the river level is near the levee crown, the pore water pressures within the levee have not changed substantially due to the relatively quick rise in the water level. The wetting front is very close to the sloped surface, forming a phreatic surface that wraps back on itself. This complexity could not be captured by a piezometric line because each point defining the line must have an equal or greater x-coordinate than the previous point.
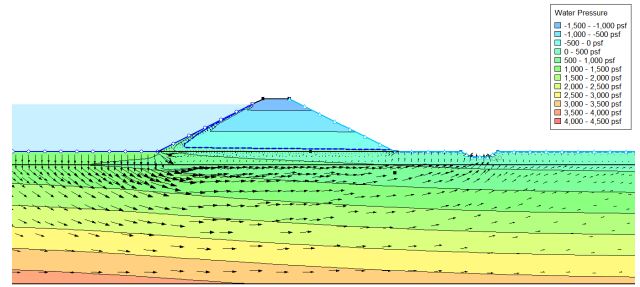
The pressure contours indicate elevated pressures within the confined aquifer. Water generally moves downward from the floodplain through the blanket material until it reaches the confined aquifer where it travels more easily towards the drainage ditch and right-hand side of the domain. Water also moves through the levee over the clay blanket, causing the pore-water pressure response shown in Figure 7. The pore-water pressure reaches a maximum value at day 15, which is 5 days after the peak of the flooding event (refer to Figure 3). Figure 8 reveals that a much greater peak in pore-water pressure occurred in the confined aquifer below the levee toe a day earlier, at day 14. Despite being further downstream and overlain by the clay blanket, the quicker response in the aquifer is primarily the result of the significant recharge area on the riverside of the levee.
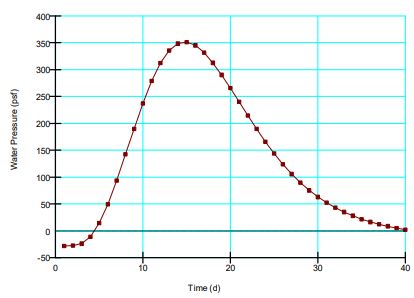
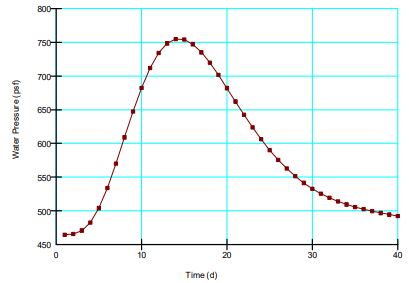
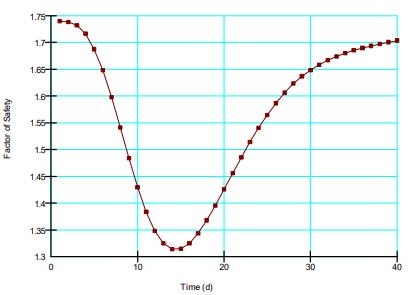
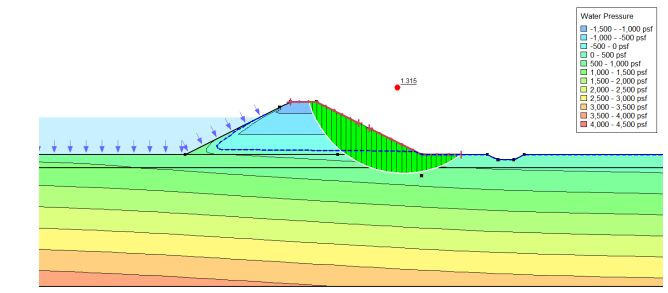
Figure 9 shows the factor of safety versus time in the case of transient analysis. The minimum critical factor of safety (1.32) was reached at a time of 14 days, which corresponds to the peak in pore-water pressure in the aquifer. The critical slip surface and corresponding pore-water pressures for day 14 are illustrated in Figure 10.
Using an Individual License
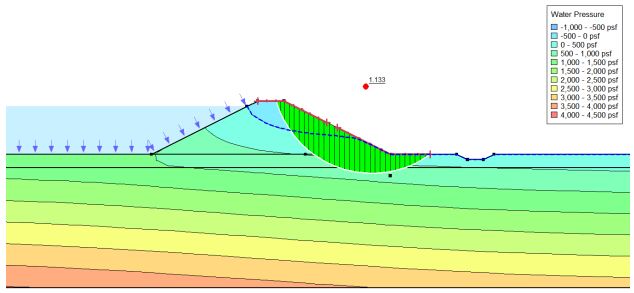
Figure 11 shows the pore-water pressures that result from applying a single piezometric line to the levee, confining unit, and aquifer. A quick overview of the pressure contours reveals that the piezometric line fails to capture the effect of the wetting front in the levee, and the pore-water pressure within the underlying confined aquifer. The failure of the single piezometric line is also highlighted in Figure 12, which compares the pore-water pressure at the base of each slice of the same slip surface from each analysis. The failure to capture the pore-water pressure response results in an overestimated factor of safety of 1.70.
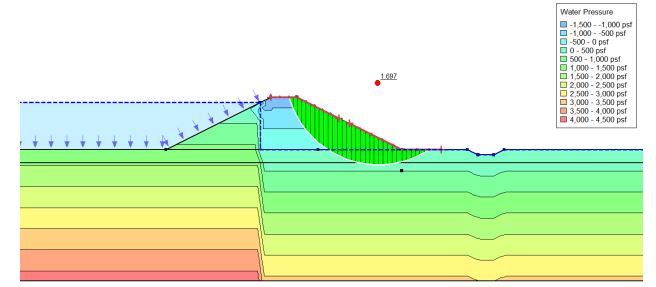
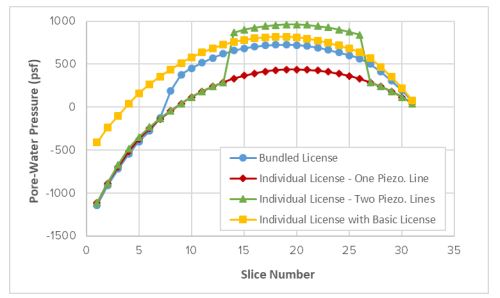
Figure 13 shows the pore-water pressures that result from applying two piezometric lines; one to the levee and blanket, and the other to the confined aquifer. A close look at the pore-water pressures reveals that the second piezometric line results in elevated pore-water pressures that approach those of the transient analysis. As shown in Figure 12, however, the pressures in slices 14 to 26 are somewhat higher than expected. This results in a slightly lower factor of safety of 1.13
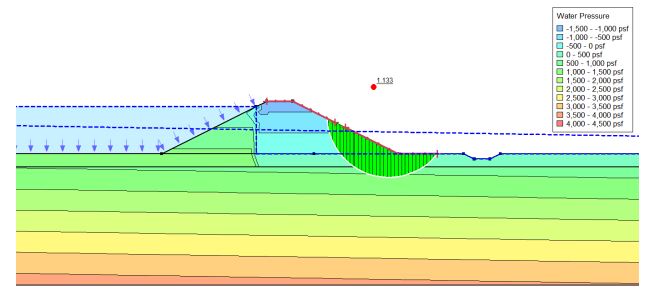
The use of two piezometric lines provides a reasonable estimate of the pore-water pressures within the levee, blanket, and confined aquifer. Unfortunately, the definition of these piezometric lines requires significant insight into the flow process. Although this can be acquired through intensive field measurements during a flood event, it is much less expensive and time-consuming to simulate the physical system using a water transfer analysis.
Using an Individual License with a Basic License
Figure 14 shows the pore-water pressure contour plot and flow vectors generated by the steady-state seepage analysis. As expected, the phreatic surface in the levee roughly assumes the shape of a parabola. The resulting pore-water pressure at the levee/blanket interface is equal to 489.75 psf, which is somewhat larger than the peak value reported in the transient analysis (refer to Figure 7). Most importantly, however, the contour plot indicates that the pore-water pressures are elevated in the confined aquifer below the levee. As suggested by the flow vectors, most of the water flows through the blanket, into the aquifer, and then laterally towards the landside of the levee. The pore-water pressure in the confined aquifer below the toe of the levee is equal to 834.14 psf, which is consistent with the peak value reported in the transient analysis (refer to Figure 8).
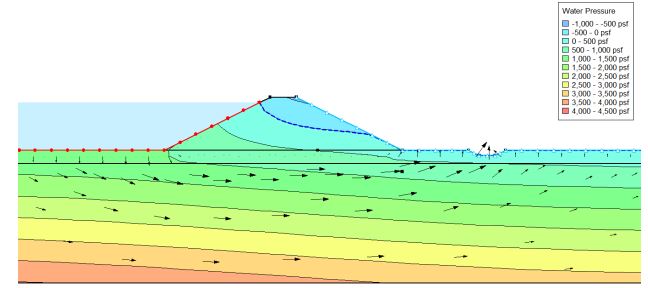
Figure 15 shows the critical slip surface and its factor of safety. As expected, the factor of safety is slightly lower than the minimum critical factor of safety reached during the transient analysis. This difference is ascribed to the larger pore-water pressures in the levee and confined aquifer during the simplified steady-state seepage analysis (refer to Figure 12). Overall, however, the steady-state analysis adequately describes the pore-water pressures and provides an acceptable estimate of the factor of safety.
Summary
This example demonstrates the benefits of using SEEP/W analyses to establish the pore-water pressure conditions for a slope stability analysis. Although the piezometric line functionality in SLOPE/W was able to capture the conditions within the levee system and confined aquifer, this required significant insight into the flow system, which is generally acquired through detailed and time-consuming field measurements.
Sources: GeoStudio - SLOPE/W - Pore-Water Pressure Definition for a Levee Stability - Information [PDF], GeoStudio - SLOPE/W - Pore-Water Pressure Definition for a Levee Stability - Project [gsz]
Want to read more like this story?

Importing pore-water pressure results from SEEP3D into a two-dimensional SLOPE/W analysis
Mar, 02, 2026 | NewsThis example replicates the “Rapid drawdown” examples illustrated in SEEP/W and SIGMA/W. The purpos...

How to Perform Dewatering in PLAXIS
Jun, 11, 2021 | NewsThe problem of changing water conditions is omnipresent in geotechnical engineering. Groundwater is...

GEO5 Slope Stability – Water Flow
Jan, 19, 2023 | Software
Using GeoStudio to conduct 3D numerical analysis of groundwater seepage and stability at the Ripley Landslide site
Jul, 30, 2024 | NewsLandslides come with significant potential for loss of life and damage to integral infrastructur...

GEO5 FEM - Water Flow
Aug, 16, 2019 | SoftwareRapid Drawdown in Dam and Levee Design: A Hydrogeologic Perspective in Slide2
Mar, 23, 2026 | NewsWhat happens to a dam or levee when the reservoir that once supported it drops rapidly? From th...
Pore Pressure and Retaining Wall Drainage
Feb, 06, 2026 | EducationThe Critical Role of Groundwater Water is the single most destructive element in retaining wall st...
Consolidation Analysis for Embankments
Aug, 12, 2022 | NewsConstruction of embankments on soft soil presents a challenge. Soft soil deposits have a high moist...

GGU-CONSOLIDATE
Jan, 08, 2015 | SoftwareForm
Looking for more information? Fill in the form and we will contact Seequent, The Bentley Subsurface Company for you.
On This Day
July 14th 1827
READ MORE
Related Video

Trending

Embankment Collapse on NH-66 in Kooriyad Triggers Engineering and Oversight Review
Fehmarnbelt tunnel advances with first element ready for immersion

Geotechnical Engineering 2032 Boom: Trends, Challenges, and Emerging Opportunities

Emergency protocols activated following offshore 7.7 magnitude earthquake in Japan
Emergency ground stabilisation protects rail works near Salford Central