2D or 3D LE? That is the Question - Yeager Airport Case Study Sponsored
- Jun, 02, 2021
- Earth Retaining Structures Mechanically Stabilized Earth (Mse) Walls Geosynthetics For Reinforcement Geosynthetics Numerical & Constitutive Modeling Slope Stability Slope Stability Analysis News On Projects / Industry News On Software News On Natural Disasters / Failures
- Authored by: Rocscience Inc
When is 2D slope stability analysis sufficient and when should 3D analysis be used in conjunction with 2D analysis?
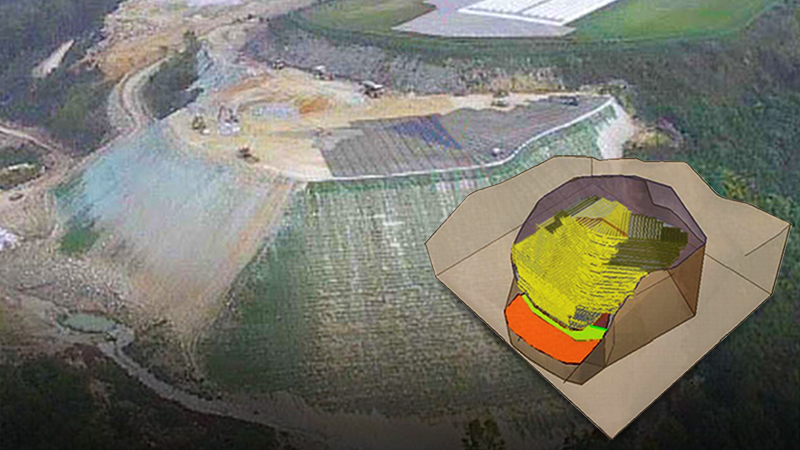
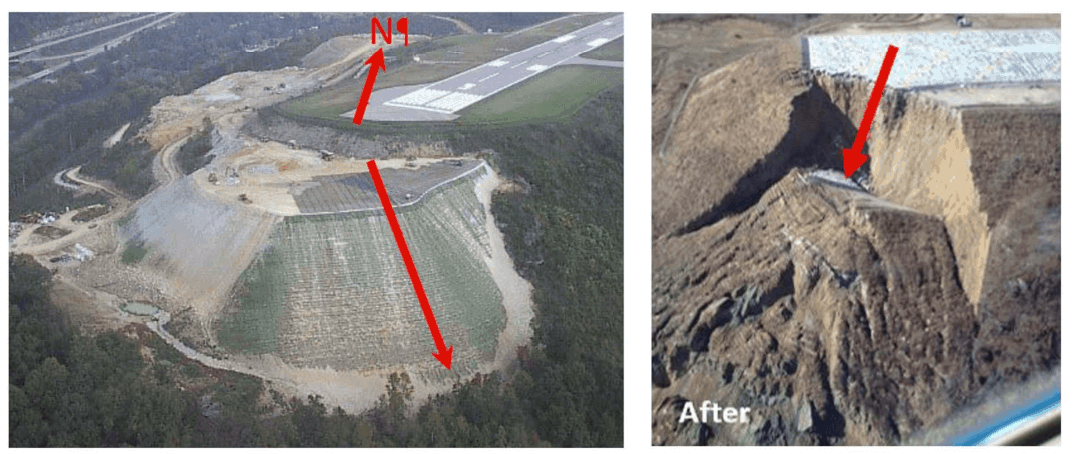
In Rocscience' February’s newsletter, a case study was highlighted of a 72-meter reinforced soil structure (RSS) which failed at the end of runway 5 of the Yeager Airport near Charleston, West Virginia in 2015. That article focused on a paper by Vandenberge et al, where 2D limit equilibrium (LE) analysis in Slide2 was used to help identify the cause of the slope failure.
Combining 2D with 3D LE analysis allows for a more detailed look into your model and can account for a variety of additional factors that could potentially generate different factors of safety (FS). This paper by James Collin, Timothy Stark, Augusto Lucarelli, Thomas Taylor, and Ryan Berg looked at the same Yeager Airport failure and conducted 3D LE analysis in Slide3 to compare with results from 2D analysis in Slide2.
RUNWAY 5 REINFORCED SOIL SLOPE
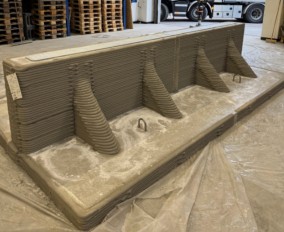
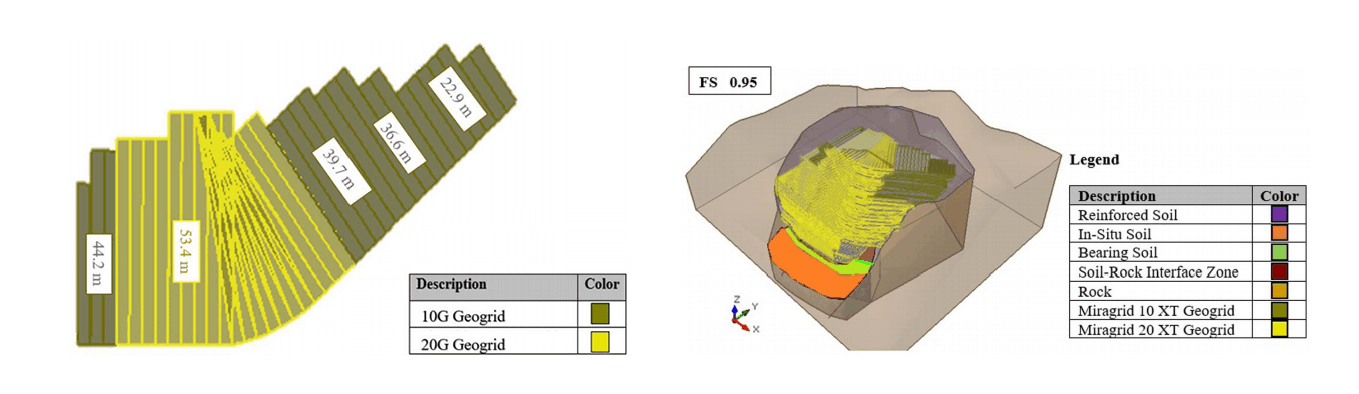
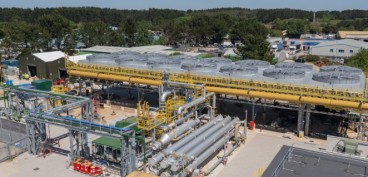
To comply with airport regulations, Runway 5 of the Yeager Airport needed to be extended in length by 150 m. Due to the mountainous terrain, a RSS needed to be constructed. Two different uniaxial geogrids were used for the primary reinforcement zone and a lightweight geogrid face wrap was used to support the surface. Both types of geogrid can be seen in Figure 1 (left).
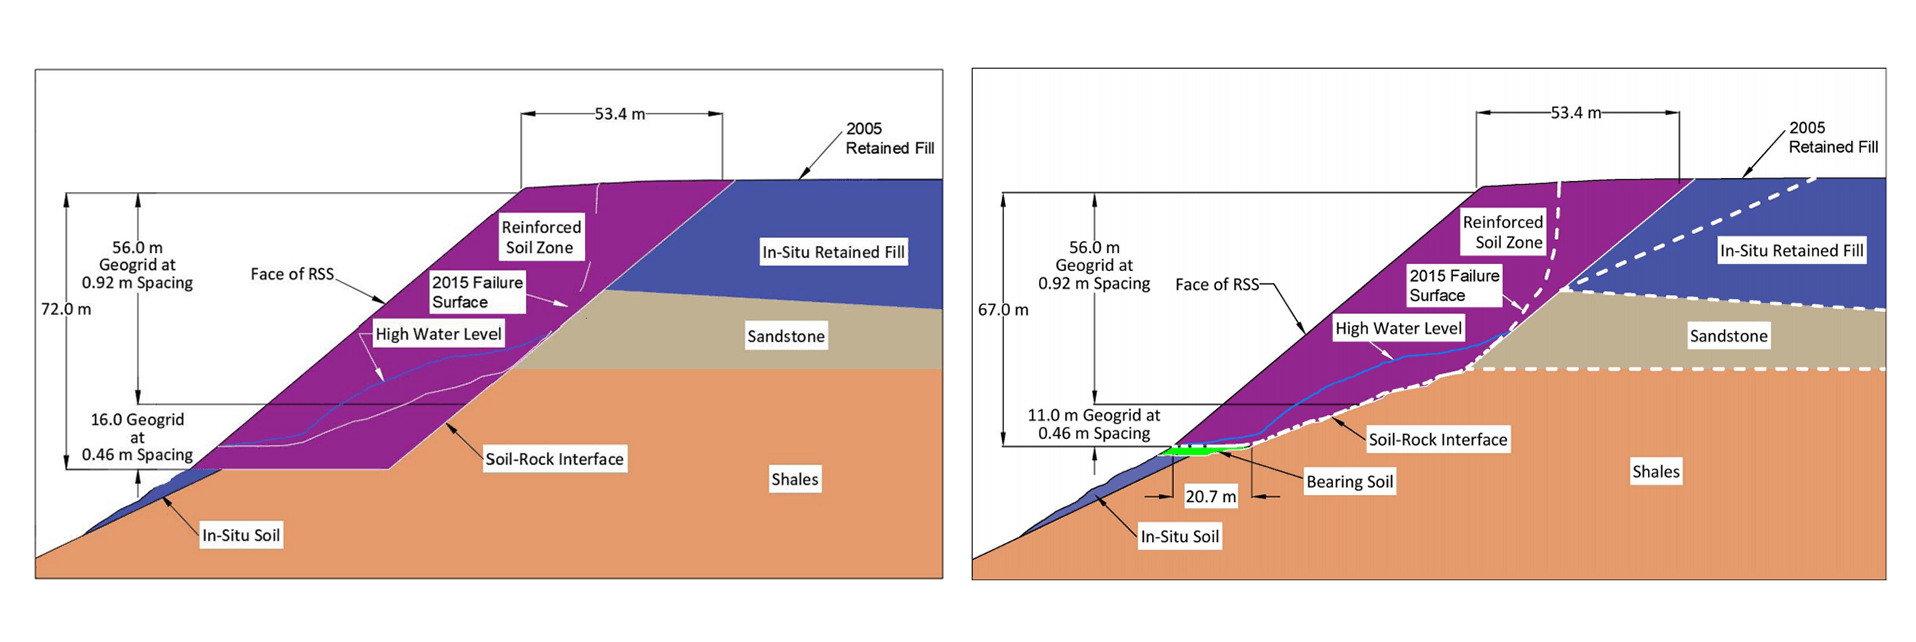
Figure 2 shows the cross section of the original design for the RSS (left) and the cross section as it was built (right). Field changes were made to the design and the RSS was placed on approximately 3m of unreinforced fill as opposed to rock. Also, the length of the geogrid at the bottom of the RSS was shortened from 53.4m to a minimum length of 20.7m.
2D & 3D LIMIT EQUILIBRIUM ANALYSES
With unreinforced slope scenarios, the difference between 2D and 3D FS results are due to differences in slope geometry, side forces and material properties. However, in cases which use reinforcement, there can be even greater differences between the 2D and 3D FS results.
What makes the Yeager Airport failure so important to study is that it was one of the largest mechanically stabilized earth (MSE) slopes and was extremely complex. Because of its size, combination of soil and rock materials, nonlinear material behaviour and the numerous layers of geogrids, accurately modeling this RSS was a huge task achieved using Slide3.
In this case study, the 3D analysis took into account:
- 3D driving forces
- 3D slope and groundwater conditions
- Overlapping geogrids
- Anisotropic geogrid tensile resistance
- Different types of uniaxial geogrids
- Construction damage to the geogrids
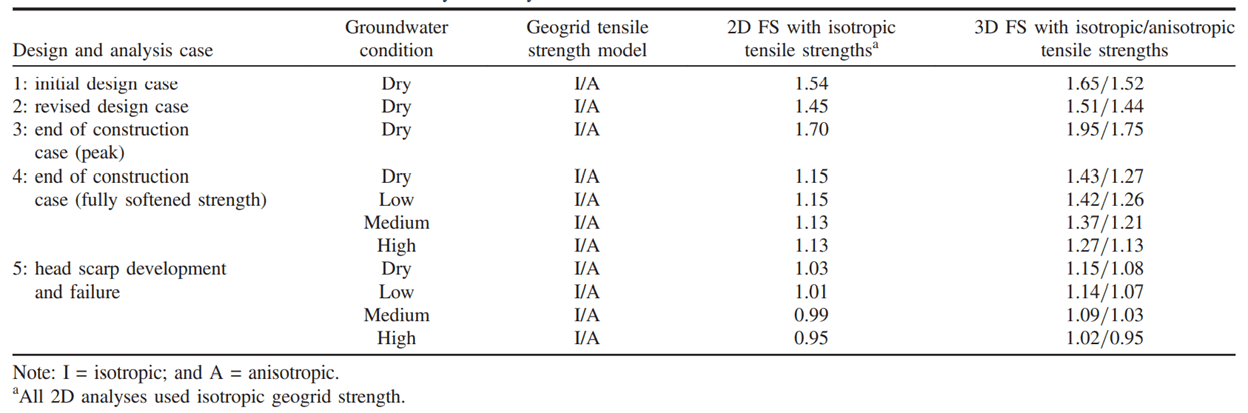
2D LE and 3D LE analysis was conducted for 5 slope scenarios (Table 1)
- Initial Design
- Revised design
- End of construction peak soil strength
- End of construction fully softened strength
- Failure
L1 corresponds to the original design in the contract plans and L2 represents the as-built case. These scenarios are represented in Table 1.
The post-failure investigation obtained samples from the primary geogrids and bearing soil at the toe of the slope. Samples from the soil-rock interface failure surface were tested and the fully softened and residual strengths were used in the stability analysis. S1, S2 and S3 represent the soil-rock interface properties and their values are shown in Table 2.
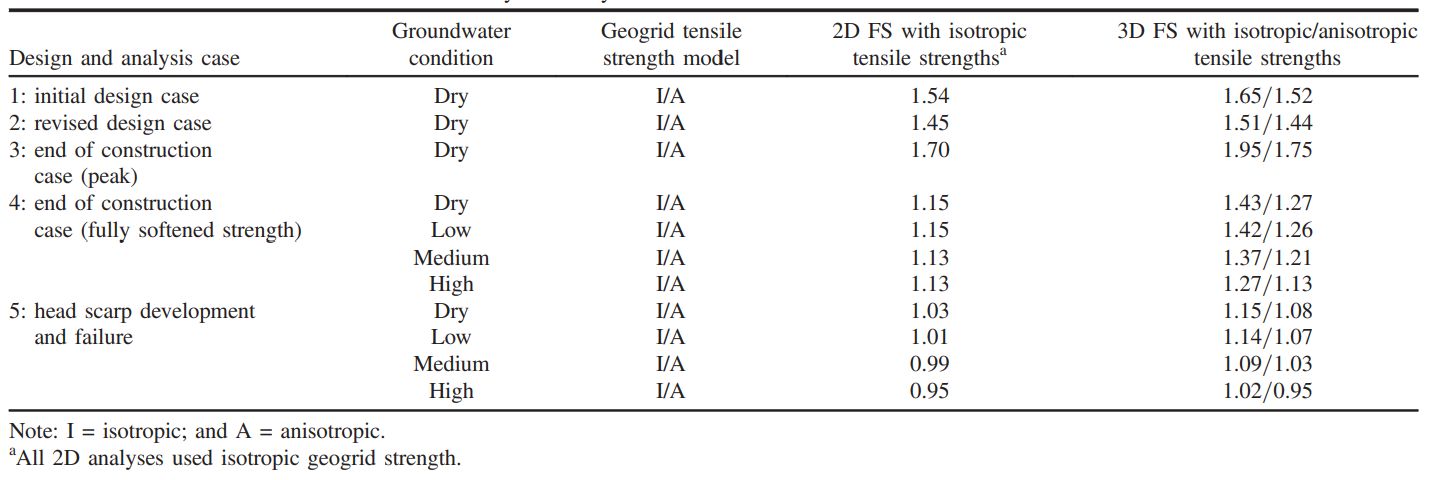
Measured and estimated geogrid material properties were used for stability analysis represented as G1, G2, and G3.
- G1- measured initial design minimum long-term design strength (LTDS)
- G2- designed geogrids accounting for installation damage
- G3- designed geogrids accounting for installation damage and creep
Figure 3 (left) shows the complexity of the geogrid layout at an elevation of 281.5 m of the RSS. 3D analysis was able to model the actual layout of each geogrid strip based on information from the construction sketches. A MATLAB version 9.7 script was written to compute the coordinates of every geogrid strip to build out the 3D model in Slide3, shown in Figure 3 (right).
The results of the 2D and 3D LE analyses are listed in the Table 3. 2D analysis used isotropic conditions whereas each 3D slope scenario was analyzed with the tensile resistance of the geogrids modeled as isotropic and anisotropic to assess the difference in tensile resistance between the MD and XMD.
This paper investigates the Yeager Airport runway failure in more depth by using Flac3D to look at the stresses and deformations in the RSS prior to failure to better understand the kinematic forces that were at play.
CONCLUSION
This paper highlights the combined application of 2D and 3D slope stability analysis which verified the failure mechanism identified in the post event forensic subsurface investigation. It also highlights the importance of accurately modelling the factors that contributed to the failure. In this case study, the 3D stability analysis conducted was in excellent agreement with the field observations and conditions at the time of the reinforced slope failure.
This brings us back to the question: When is 2D analysis sufficient and when should 2D and 3D analysis be used together?
We encourage you to read the full paper to see the full details.
If you use 2D programs for slope stability analysis, start a free trial of Slide3 today and see how 3D Limit Equilibrium analysis can benefit you.
Sources: Stability and Stress-Deformation Analyses of Reinforced Slope Failure at Yeager Airport, 2D or 3D LE? That is the Question - Yeager Airport Case Study
Want to read more like this story?

3D Slope Stability Analysis of an Open Pit Mine in Minas Gerais, Brazil
Jul, 08, 2022 | NewsBy Thiago Bretas and Felipe Vilela, BVP Engenharia. Two-dimensional (2D) limit equilibrium analysis...

Why Run PLAXIS 3D Analysis?
Jun, 07, 2021 | NewsMost geotechnical engineers use FEA software packages for their geotechnical design. It is especial...

Rocscience | Geotechnical Software for Open Pit Mining
Aug, 22, 2022 | NewsSurface mining, whether you call it open pit, opencast, or open cut is a common method of extractin...

Importing pore-water pressure results from SEEP3D into a two-dimensional SLOPE/W analysis
Mar, 02, 2026 | NewsThis example replicates the “Rapid drawdown” examples illustrated in SEEP/W and SIGMA/W. The purpos...

Rocscience | Does 3D Slope Stability Analysis Always Produce Higher Factors of Safety than 2D?
Jul, 13, 2022 | NewsBy Reginald Hammah and Frema Awuku-Asabere A lot has been written about 3D slope stability analysis...

How Geotech’s can overcome time crunch: UAV Photogrammetry and 3D LEM Analysis
Aug, 23, 2022 | NewsWhen it comes to open pit mines, generally, the steeper the slopes, the greater the ore extraction,...

Rocscience | Vallcebre Landslide Stability Analysis Using Geophysical Data and Limit Equilibrium Methods in Slide3 and Slide2
Apr, 12, 2023 | NewsLandslides are complex bodies that are often made of heterogeneous geological materials and gradati...

Coffee Corner: Geotechnical Analysis (AM) – Railway Cut Stabilization with Reinforcement: Comparing 2D and 3D LE Stability Analyses in GeoStudio
May, 29, 2025 | EventStabilization is required for cut slopes identified to have Factor of Safety values below the desig...

Rocscience | On the comparison of 2D and 3D stability analyses of an anisotropic slope
Jun, 27, 2022 | NewsThe Adoption of 3D Limit Equilibrium Method 2D limit equilibrium analysis is a powerful tool for pr...
Form
Looking for more information? Fill in the form and we will contact Rocscience Inc. for you.
On This Day
June 26th 1824
READ MORE
Related Video

Trending

New crustal stress map of North America

Using Terzaghi’s Equation in Foundation Design

Parameters Variation: Model Customization and Sensitivity Analyses

UK geothermal projects expand from Cornwall power to Birmingham heating
Stop Guessing, Start Designing: Introducing Support Designer in Slide2
Development program prepares new engineers for success