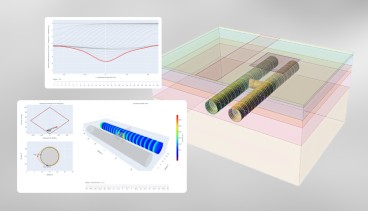
Orica Digital Solutions Geosolutions' Unlocking operational insights for subsurface injection and production with InSAR data begins on Jul 21st 2026
Orica Digital Solutions Geosolutions' Unlocking operational insights for subsurface injection and production with InSAR data begins on Jul 21st 2026
Create a free account and view content that fits your specific interests in geotechnical engineering Learn More

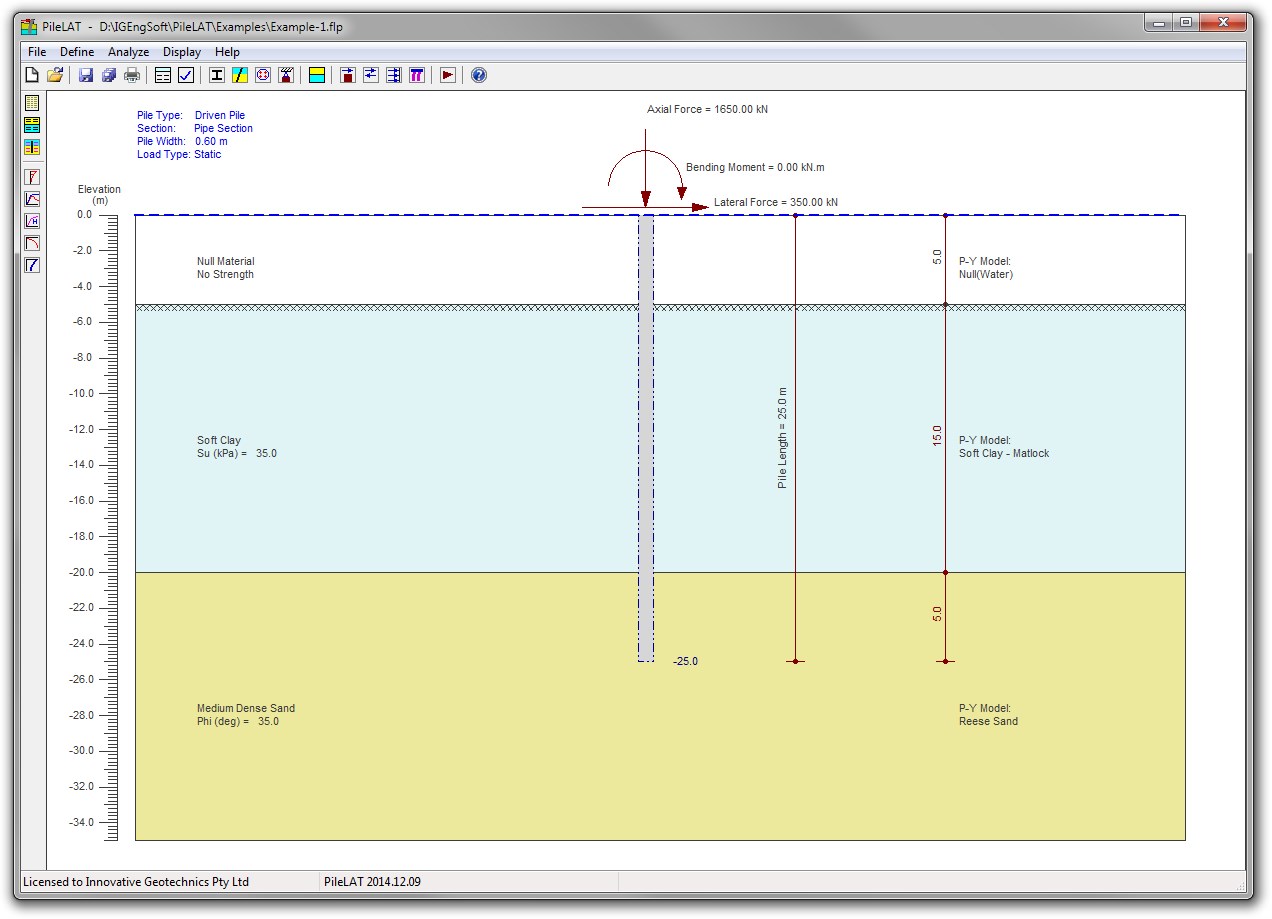
PileLAT is a finite-element based program that analyzes the behaviour of laterally loaded piles (Single piles mainly under lateral loading) based on automatically generated nonlinear p-y curves for various soil and rock types.
Download Documentation Some of the main features are:
1. Standard window-style dialogs, push buttons, drop menus, list boxes, EXCEL-like data grid cells, slide bars, radio buttons, check boxes and toolbars can be accessed in the program;
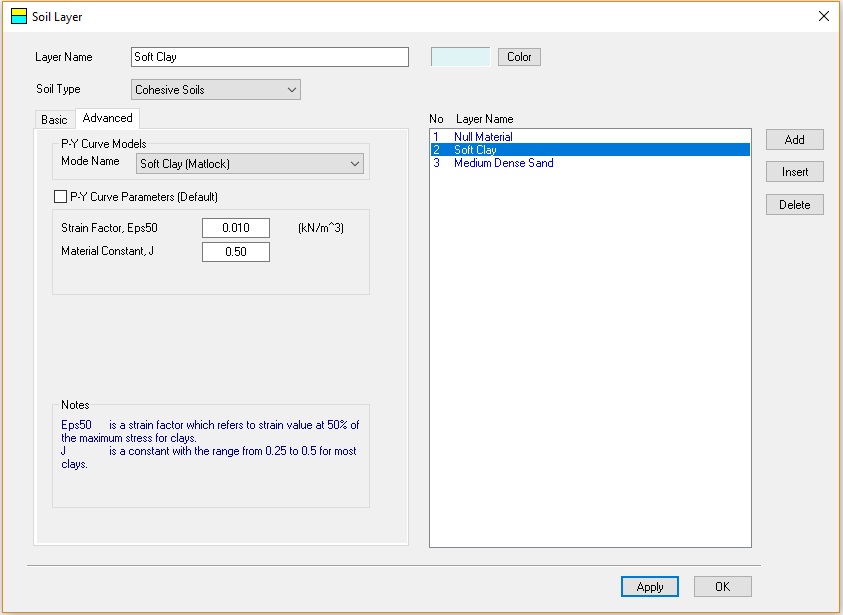
2. Automatic generation of nonlinear soil resistance p-y curves for various soil types such as cohesive soils, cohesionless soils and rocks. By this approach, all p-y curves are reasonably placed into the relevant categories instead of being listed together. This helps the user to select the appropriate p-y curves in the analysis;
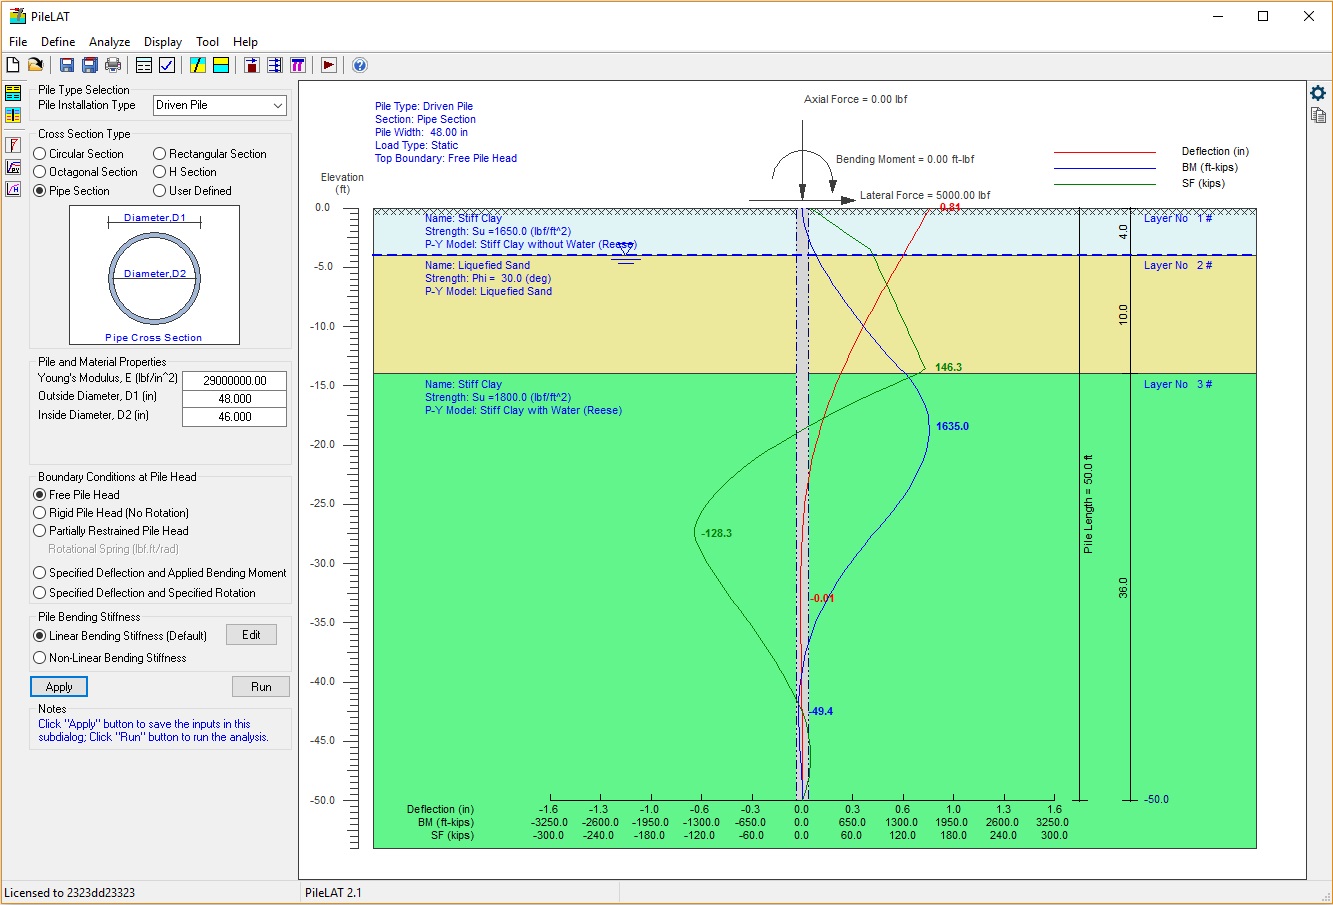
3. Soil resistance p-y curves generated for cohesive soils include API soft clay, Matlock soft clay, Stiff clay with or without water (Reese) and Modified stiff clay without water;
4. Soil resistance p-y curves generated for cohesionless soils include API sand, Reese Sand and Liquefied sand;
5. Soil resistance p-y curves generated for rocks include Weak rock, Strong rock, Massive rock and Calcareous rock;
6. A simple elastic-plastic soil resistance (p-y) curve is provided for all soil types for the preliminary lateral force analysis if required;
7. Soil resistance (p-y) curve with using elastic subgrade modulus for all soil types;
8. Soil resistance (p-y) curves for each node can be viewed, copied and printed. No need to specify the node locations before the analysis in order to access the p-y curve information. Once the analysis is completed successfully, p-y curves for all the nodes are automatically available to the user;
9. Soil resistance (p-y) curves are automatically adjusted to consider the soil-layering effects in according to the approach proposed by Georgiadis;
10. Both static and cyclic behaviour of soils can be considered;
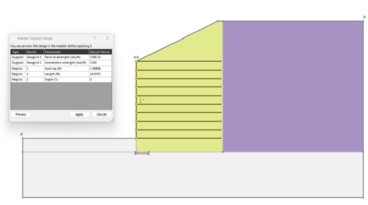
11. Pile batter and sloping ground surface can be modelled through an interactive dialogue where the geometry of the pile batter and ground surface slope can be graphically updated and viewed by the user with moving the relevant slide bars;
12. P-multipliers can be defined by the user for each soil layer to consider the potential pile group effects for closely-spaced piles. The user also can use this option to purposely reduce the resistance of some soil layers if required;
13. Multiple pile segments with different user-defined elastic bending stiffness or plastic bending moments can be specified by the user;
14. Free-field soil lateral displacement loading along the pile length can be considered by the program at the specified node locations;
15. Distributed horizontal shear forces and bending moments can be specified by the user at the node positions;
16. Boundary conditions at the pile head such as free head, rigid head and partially restrained head with elastic rotational spring can be considered;
17. An interactive dialogue is available to the user to specify the distributed loading along the pile length and the user is able to see the locations of the nodes with the applied loading;
18. Different pile section types such as circular section, rectangular section, steel H-section, steel pipe section, octagonal section and user-defined section can be selected by the user;
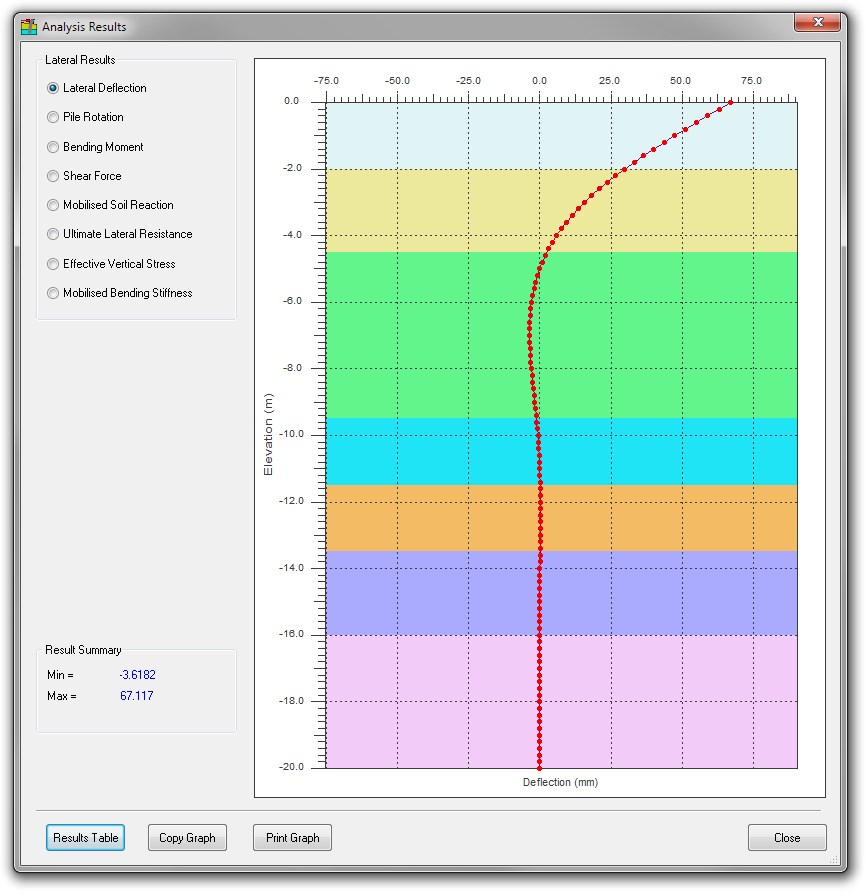
19. Detailed analysis results are presented in EXCEL-like format and can be easily selected and copied into the third-party program such as EXCEL for further processing;
20. Basic capability of calculating pile settlement under compressive axial loading is available to the user. Load transfer t-z and q-w curves are automatically generated based on the pile installation type and soil type. The feature is very useful and it enables the user to carry out preliminary pile settlement analysis without the need to set up the analysis files in different programs. Detailed pile axial capacity and settlement analysis can be carried out by PileAXL 2014 which has more advanced features if required;
21. Load-settlement curve can be generated by the program for the specified axial loading at the pile head. Preliminary estimations on the ultimate shaft resistance, ultimate end bearing resistance and ultimate axial pile capacity are carried out by the program and the preliminary results are shown on the load-settlement curve graph;
22. Innovative soil layer and parameter input dialog is provided to help the user to enter the input data more easily and smoothly;
23. A well-designed result output dialog is provided for the user to view all the relevant results graphically. Switching among different results is very straightforward. All the analysis results along the pile length are presented together with the soil layer geometry. Therefore, the analysis results within each soil layer can be viewed by the user conveniently from the graph of the results;
24. Automatic generation of load deflection curves such as horizontal load vs top deflection, bending moment vs top deflection and maximum bending moment vs top deflection once the analysis is successfully completed;
25. An interactive graphical presentation of pile and soil layer geometry is provided. Important changes in the input data such as pile length, the number of soil layers, soil layer name, soil layer thickness, soil layer colour, p-y model type, water table position, certain soil parameters and pile loading will be automatically updated in the graph. It is very convenient for the user to visually view the input change.
| Category | Deep Foundations |
| Licence Type | Commercial |
| Operating Systems | Windows 95/98, Windows 8, Windows 7, Windows Vista, Windows NT, Windows XP |
| Current Version | 2.2 |
| Release Date | 2017-12-19 00:00:00 |
| Developer | Innovative Geotechnics Pty Ltd |
| Developer Website | https://www.pilegroups.com/pilelat |
| Developer Email | [email protected] |

This feature is only available for software listings at the Advanced or Lead Sponsorship Level. Each software provider can upgrade the sponsorship level of their software listing by visiting the sponsorship levels page.
Recommended Software

Aug, 16, 2019
GEO5 Spread Footing

Aug, 30, 2019
HeliCAP® Helical Capacity Design Software Version 3.0

Aug, 30, 2019
GEO5 Spread Footing CPT


Related Software


Developed by
Innovative Geotechnics Pty Ltd
Innovative Geotechnics Pty Ltd
News on Software

On This Day
July 20th 1940
READ MORE