Rocscience | Vallcebre Landslide Stability Analysis Using Geophysical Data and Limit Equilibrium Methods in Slide3 and Slide2 Sponsored
Landslides are complex bodies that are often made of heterogeneous geological materials and gradational physical properties. Due to the intricate nature of the landslides, traditional geotechnical methods may not provide you with detailed insights into rock and soil materials, and geomorphological and stability conditions.
This study presents a unique, reliable, and cost-effective approach to the stability analysis of a Spanish Pyrenees slow-moving landslide by combining Geophysical evaluation data into Rocscience’s 3D Limit Equilibrium program Slide3 for calculating the factor of safety. Further, a 2D analysis was also done on the sliding surfaces using Slide2 to compare and validate 3D results.
Geological Overview: Spanish Landslide Region
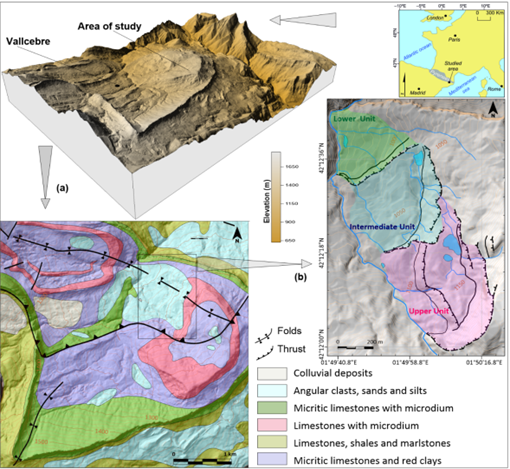
The Vallcebre landslide in the Pyrenees range, 110 km west of the Mediterranean Sea is situated in the Llobregat river basin. The geological compositions of the landslide include claystone, shale and layers of gypsum sliding above a thick limestone substrate. Most of the initial faults found in slopes around the landslide indicated its evolution over time.
The Vallcebre landslide is particularly very sensitive to groundwater fluctuation and rainfall, therefore displacements can occur due to changes in water level. When water enters the landslide, it can change subsurface properties causing deformations and ultimately triggering landslide slope failure. A geophysical method like Electric Resistivity Tomography (ERT) can be a useful technique to determine the position of the water table and was used in this study to identify the effect of water on landslide dynamics.
Geophysical Analysis Methods
ERT: The Electric Resistivity Tomography (ERT) method is popular in terms of providing detailed imaging of the distribution of subsurface electrical resistivity. While this method was applied to the lower units of the landslide, a Syscal Pro resistivity meter with an array of Wenner-Schlumberger, a commonly used technique for soil resistivity measurements, was employed to collect geoelectrical data.
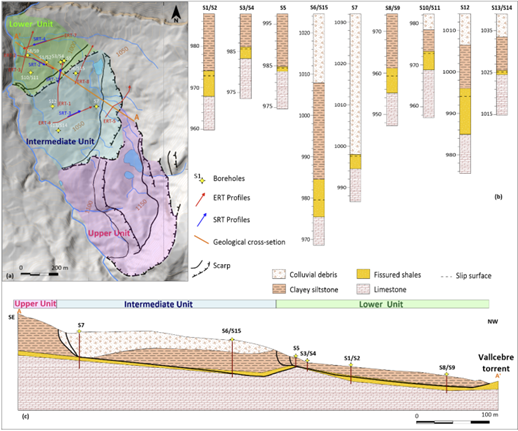
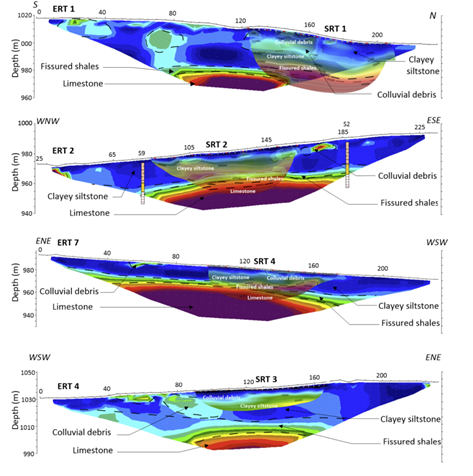
The electrodes and ground contact resistance readings were obtained for a total of 7 profiles in the landslide area, shown in Figure 2, which also outlines the results of four profiles from the SRT analysis.
SRT: The advantage of the Seismic Refraction Tomography (SRT) method over electrical methods is a direct relationship between porosity and acoustic velocities. However, when it comes to complex geological conditions, electrical techniques are way more effective for identifying the position of water tables.
ERT and SRT Results
The results that were collected from the two geophysical analyses were interpreted through the inverted cross-sections from Wenner-Schlumberger (W-S) array. The electric resistivity variations along the ERT profiles outline the main material layers of the study area.
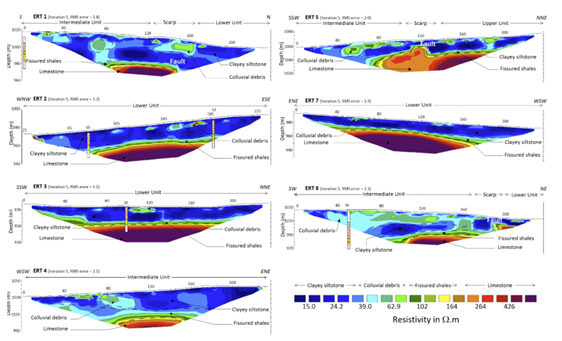
These ERT cross-sections show low resistivity values in the upper portion and high resistivity values in the deeper zone consisting of clayey siltstone and limestone. The data obtained from SRT profiles were used to classify the lateral variation of the materials.
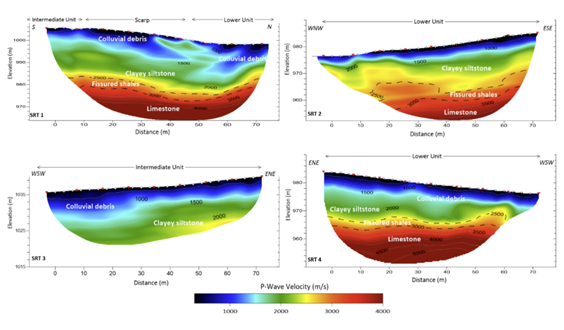
Finally, the results obtained through ERT and SRT analyses were compared by adding the closest lithological data and the comparison showed agreement between the two results.
Material Properties and Analysis Parameters
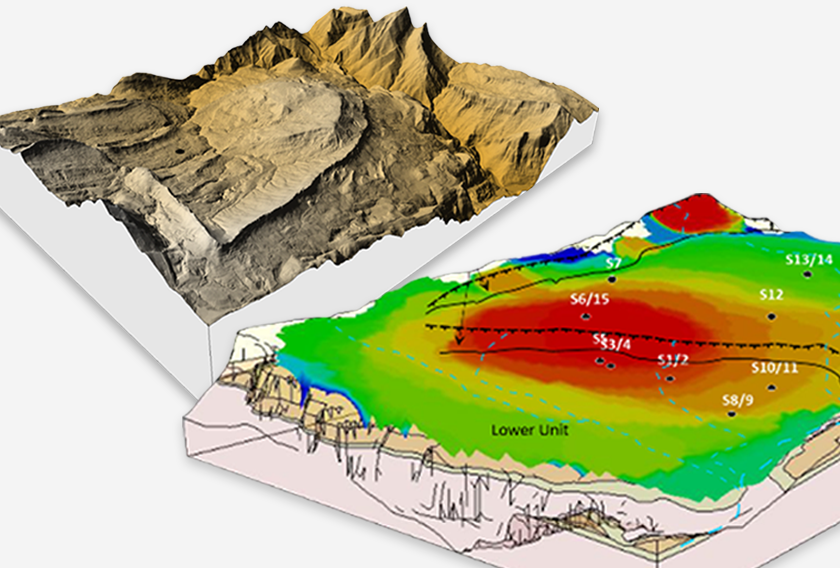
Using a unique set of data including boreholes, electric resistivity range of materials, and subsurface formations collected through seismic refraction profiles, a 3D geometry was created for analysis using the Limit Equilibrium Method (LEM) in Slide3. Further, a 2D LEM analysis was also conducted on the 3D cross sections of sliding surfaces and the results were compared.
Table 1. Geotechnical properties of materials used in Rocscience Slide3 software (Bedrosian et al., 2012; Cahyaningsih et al., 2019).
Unit name | Unit Weight (kN/m3) | Cohesion (kPa) | Phi (°) |
Limestone* | 20 | -*1 | -*1 |
Clayey Siltstone | 18 | 0 | 14.7 |
Fissured Shales | 19 | 0 | 11.8 |
Debris of Gravel | 20 | 0 | 14.7 |
Limestone* does not have cohesion and friction value because it has been considered as an infinite strength material (Corominas et al., 2005, 2000).
Table 2. Analysis parameters used in Rocscience Slide3 software.
Group | Parameter | Value |
Unit weight of water | 9.81 kN/m3 | |
Convergence | Number of columns in X or Y | 50 |
Intercolumn force function | Half Sine | |
Surface Options | Search Methods Maximum Iterations Iteration tolerance | Cuckoo Search 30 0.0001 |
Landslide Stability Analysis with Limit Equilibrium Method
The Limit Equilibrium Method (LEM) of slope stability analysis is the most common and widely used technique for analyzing landslide stability. In this study, the LEM method was used for its simplicity, reliability and capability of providing insights into the spatial distribution of potential sliding surfaces of the transitional Spanish landslide.
3D Model Creation in Slide3: First, borehole data was imported into Slide3 using Borehole Manager tool for 3D geometry creation. Next, coordinates, formations, and water elevation for each borehole were defined.
Since ERT and SRT data had specific electric resistivity and velocity ranges for each material, both data types were divided into four different sets (specifying geological formations of the landslide) and saved as XYZ data grid. Benefitting from Slide3’s capability to generate surfaces from XYZ data, a 3D model of the landslide was built and evaluated.
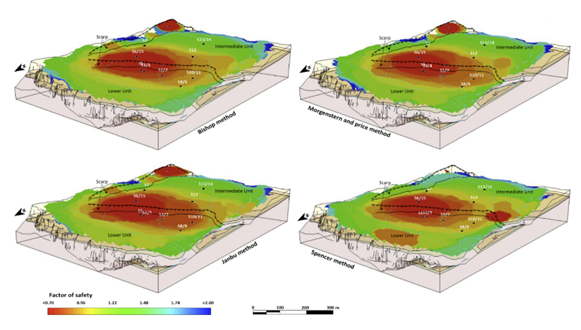
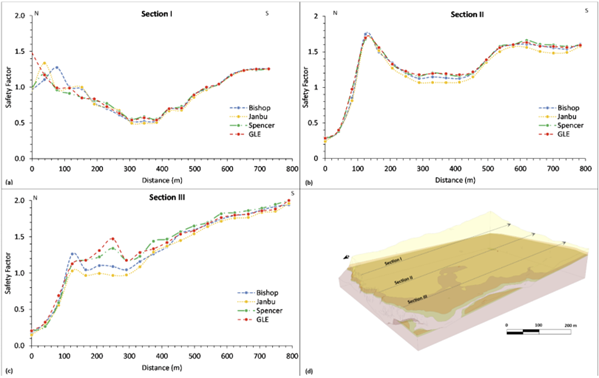
3D LEM Analysis Results: Employing Slide3’s four 3D limit equilibrium methods of analysis including Bishop, Janbu, Spencer and Morgenstern-Price (GLE), a factor of safety of 0.7 was found in the vicinity of the landslide. In this case, four different methods were used to verify the results and accurately capture the instability of the landslide. All four methods outputted similar results – a factor of safety of 0.7 outlining the instability of the landslide region.
Slide2's 2D Analysis on 3D Cross-Sections
Three different cross-sections were generated from Slide3’s 3D model along the sliding surface and analyzed with the Slide2 engine available in Slide3 to compare, verify, and interpret 3D results through a simplified 2D version.
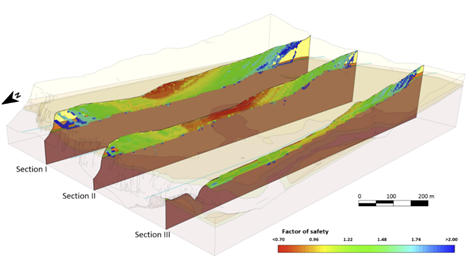
Slide2’s 2D analysis has shown about 10-15% differences from the 3D analysis – the deviation of the factor of safety along the sliding units in the 2D analysis showed slightly higher values of about 10% for sections I & II, whereas the value for section III was about 15% which was lower than the 3D analysis. This minor difference between 2D and 3D analysis has commonly been found in some similar studies in the past.
Concluding An Integrated Approach to Landslide Stability Analysis
- Slope stability analysis of the Vallcebre landslide using geophysical data in Slide3’s 3D LEM slope stability analysis has proven to be successful in calculating factor of safety for the critical sliding surface.
- Using four different Limit Equilibrium Methods (Bishop, Janbu, Spencer and Morgenstern, and Price) available in Slide3 and Slide2, it was possible to reach a concrete approximation of the factor of safety which showed a good agreement between 3D and 2D results.
- Further, the potential sliding surface showed that a landslide could occur between the lower and intermediate units.
- Overall, this experiment set an example of a one-of-a-kind and very cost-effective approach to landslide stability analysis.
Read the full paper for a deep understanding of this unique experiment.
Thoughts from Rocscience: 2D and 3D Analysis Complement Each Other
When analyzing a complex and everchanging structure such as the Vallcebre landslide, a full 2D and 3D Limit Equilibrium assessment can provide you with comprehensive insights into the non-balanced forces, and magnitude and help evaluate the spatial distribution of the instability.
Two-dimensional analysis being a traditional method doesn’t always consider different geological materials along the slope region while a 3D analysis estimates the realistic representation of the slip surface of a slope. However, the level of data needed for a 3D analysis isn’t always available, this emphasizes the need for both 2D and 3D analysis.
Landslide Stability Analysis in Slide3 and Slide2
Get Relevant Results that You Can Trust
Free TrialsWant to read more like this story?

3D Slope Stability Analysis of an Open Pit Mine in Minas Gerais, Brazil
Jul, 08, 2022 | NewsBy Thiago Bretas and Felipe Vilela, BVP Engenharia. Two-dimensional (2D) limit equilibrium analysis...

Rocscience | Geotechnical Software for Open Pit Mining
Aug, 22, 2022 | NewsSurface mining, whether you call it open pit, opencast, or open cut is a common method of extractin...

2D or 3D LE? That is the Question - Yeager Airport Case Study
Jun, 02, 2021 | NewsWhen is 2D slope stability analysis sufficient and when should 3D analysis be used in conjunction w...

Using GeoStudio to conduct 3D numerical analysis of groundwater seepage and stability at the Ripley Landslide site
Jul, 30, 2024 | NewsLandslides come with significant potential for loss of life and damage to integral infrastructur...

Rocscience | On the comparison of 2D and 3D stability analyses of an anisotropic slope
Jun, 27, 2022 | NewsThe Adoption of 3D Limit Equilibrium Method 2D limit equilibrium analysis is a powerful tool for pr...

Importing pore-water pressure results from SEEP3D into a two-dimensional SLOPE/W analysis
Mar, 02, 2026 | NewsThis example replicates the “Rapid drawdown” examples illustrated in SEEP/W and SIGMA/W. The purpos...

Slide3
Aug, 28, 2020 | Software
Slope Stability Analysis of an Open Pit with Weak Layers, Using RS3 and Slide3
Dec, 09, 2022 | NewsThe Limit Equilibrium Methods (LEMs) and Finite Element Methods (FEMs) are extensively used in slop...

Technical Workshop: Slope Stability Analysis with Limit Equilibrium (Slide2) and Finite Element (RS2)
Jun, 10, 2026 | EventFollowing the Indonesia User Group Meet on October 13th, the two-day technical workshop will cover c...
Form
Looking for more information? Fill in the form and we will contact Rocscience Inc. for you.
On This Day
July 26th 1963
READ MORE
Related Video

Trending
Seven Frequently Asked Questions about Helical Piles

Block caving: A new mining method arises

Categories of isolated foundation footings
Maharashtra's longest road tunnel to be completed soon

Carnian Pluvial Episode: That time when it rained for 1-2 million years
Major wastewater tunnel procurement begins in southern Sweden