Pseudo-static analysis in Bentley's PLAXIS Sponsored

Despite being a simplified approach, finite element pseudo-static analysis may provide a reliable tool due to its simplicity and relative inexpensiveness.
The fundamentals of pseudo-static analysis in Bentley's PLAXIS software are presented below.
Learn more about PLAXIS CONNECT
Time-domain analysis using acceleration (velocity or displacement) time histories generally provide the most accurate tool for the simulation of the response of geotechnical structures under dynamic loading, this type of analysis is typically very time-consuming.
As a result, a pseudo-static analysis may provide at least a preliminary assessment of the stability of geotechnical structures. In this approach, the effects of dynamic loading (such as earthquake-induced loading) are represented by equivalent inertial forces, which are approximated as constants body forces, with magnitude proportional to the horizontal and/or vertical accelerations imposed by the dynamic loading:
- Fx = kx *W
- Fy = ky *W
- Fz = kz *W
where Fx, Fy and Fz are the components of the body force along x-, y- and z-direction, kx, ky and kz are the corresponding pseudo-static acceleration coefficients, which are input parameters, and W is the weight of the mass. Note that these forces are applied to the whole mesh.
Three examples described in the literature (Loukidis et al.,2003; Kontoe et al., 2013) are reproduced using PLAXIS 2D CONNECT Edition V20 Update 2 to illustrate the fundamentals of the pseudo-static approach. In all examples, 2D plane-strain conditions are considered.
1. Level ground deposit subjected to a horizontal pseudo-static acceleration
The first example consists of a level deposit of soil with 12.0 m of thickness overlying a perfectly rigid bedrock. The mechanical response of the soil deposit is modeled with Mohr-Coulomb model. The water level is located at the soil-rock interface, with the soil deposit being considered fully dry.
A horizontal pseudo-static acceleration coefficient of kx = −0.50 is applied. Conventional static displacement boundary conditions are considered, consisting of restraining the horizontal displacements along the lateral boundaries of the model and both horizontal and vertical displacements along the bottom boundary of the model.
The obtained value of the critical kx was equal to 0.444.
The model and the shear strains in the last step of the analysis are depicted in Figure 1.
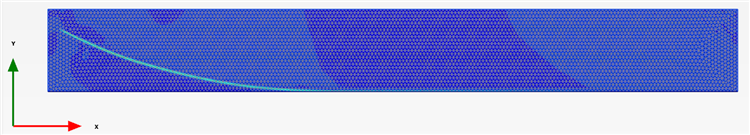
Figure 1: Level ground deposit model phases and conditions.
2. Homogeneous dry slope subjected to a horizontal pseudo-static acceleration
The second example concerns the stability of a homogeneous dry slope when subjected to a horizontal pseudo-static acceleration of −0.30 g. The Mohr-Coulomb model is employed in the numerical analysis and the only difference in relation to the previous example consists of the use of an associated flow rule, meaning that a dilatancy angle, y, of 20° is adopted in this case. The initial stress state is generated via: (1) generation of the stress state in a level ground deposit using a K0-procedure; and (2) simulation of the excavation required to shape an 8 m-high slope.
Subsequently, a pseudo-static analysis is performed to evaluate the critical horizontal pseudo-static acceleration coefficient, kx,crit.
The failure mechanism is illustrated in Figure 2 and the critical horizontal coefficient was equal to 0.243.

Figure 2: Incremental shear strains at the last step of the pseudo-static analysis of a homogeneous dry slope
3. Cantilever retaining wall subjected to a horizontal pseudo-static acceleration
The third example consists of a 1.0-thick and 20.0 m-long cantilever retaining wall modeled with solid elements and “wishedin-place” in a homogeneous dry 40 m-thick soil deposit overlying a rigid bedrock.
Regarding the wall, its mechanical response was modeled using a simple isotropic linear elastic model, with a Young modulus of E = 28 GPa and a Poisson’s ratio of n = 0.13. Moreover, its unit weight was considered 24.5 kN/m3. The soil-structure contact was considered perfectly rough, meaning that no interface was used to simulate it. A construction phase sequence consisted of: (1) generation of the stress state in a level ground deposit using a K0-procedure; (2) simulation of the “wished-in-place” construction of retaining wall and of the excavation required to shape a 8 m-deep cutting; and (3) application of a horizontal pseudo-static acceleration of −0.40 g.
As shown in Figure 3, plastic stress points developed at the base of the model and around the wall but they do not interact with each other. The kx,crit coefficient was estimated at 0.353.
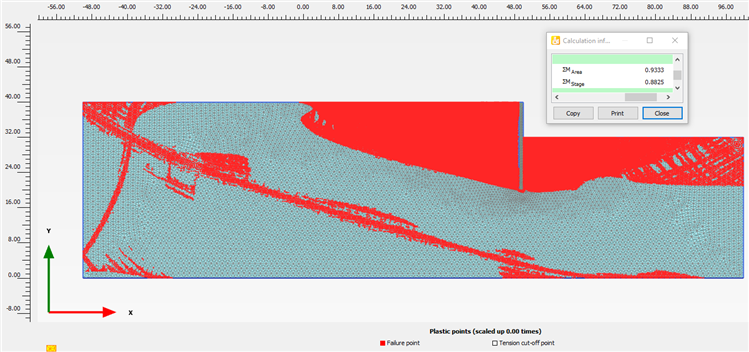
Figure 3: Plastic points at the last step of the pseudo-static analysis of a cantilever retaining wall
Conclusions
In all three cases analyses, critical horizontal pseudo-static acceleration coefficients similar to those reported in the literature were obtained. The force-based pseudo-static analysis may be a reliable tool for the preliminary assessment of the stability of geotechnical structures against seismic failure.
References
Kontoe, S., Pelecanos, L. and Potts, D. (2012). An important pitfall of pseudo-static finite element analysis. Computers and Geotechnics, 48, 41–50.
Loukidis, D., Bandini, P. and Salgado, R. (2003). Stability of seismically loaded slopes using limit analysis. Géotechnique, 53 (5), 463–479.
For more information on the three case studies examples click the following link: Bentley
Want to read more like this story?
Tutorial of finding the required depth of embedment of a sheet pile retaining wall using the global factor of safety and the Eurocode 7 approach
Feb, 06, 2026 | EducationA cantilever sheet pile wall supporting a 3.5 m deep excavation in dry sand (γdry = 15.3 kN/m³, φ′...

Rocscience | The Power of RS3's Dynamic Analysis in Evaluating Earthquake Response in Residential Buildings
May, 24, 2023 | NewsTo estimate, predict or understand how buildings and other infrastructure respond to earthquakes (s...
Lateral Earth Pressure States and Coefficients
Feb, 06, 2026 | EducationIntroduction to Lateral Earth Pressure Soil, unlike a true fluid, exhibits both density and intern...
7.5. Example Problems
Jan, 01, 2021 | EducationProblem 7.1: Gravity Wall Rankine and Coulomb Methods For the retaining wall shown in the figure b...

Rocscience | Undrained analysis of a deep excavation in clayey soils using PLAXIS Hardening Soil model in RS2
Apr, 28, 2023 | NewsWhen analyzing a geotechnical problem, different design parameters are utilized depending on draine...

Bearing Capacity of Pile Foundations: Calculation Methods for Qs
May, 28, 2024 | EducationIn this third, and last, article about pile foundations’ load-bearing capacity, we are going to...

Importing pore-water pressure results from SEEP3D into a two-dimensional SLOPE/W analysis
Mar, 02, 2026 | NewsThis example replicates the “Rapid drawdown” examples illustrated in SEEP/W and SIGMA/W. The purpos...

midas GTS NX
Dec, 15, 2022 | SoftwareConsiderations and Applications of FEA
Oct, 13, 2025 | EducationSetting up an FE model in geotechnical engineering is a process that requires careful consideration...
Form
Looking for more information? Fill in the form and we will contact Bentley for you. Alternatively, you can visit Bentley's website and speak with a Bentley Geotechnical Expert.
On This Day
July 15th 1982
READ MORE
Related Video

Trending

New crustal stress map of North America

Using Terzaghi’s Equation in Foundation Design

Parameters Variation: Model Customization and Sensitivity Analyses

UK geothermal projects expand from Cornwall power to Birmingham heating
Tailrace tunnel breakthrough advances Australia’s largest renewable project

A Legacy of Leadership, Mentorship & Service: Gary L. Seider P.E.