Liquefaction During the 1964 Niigata Earthquake
Contents [show]
Introduction
1964 Niigata Earthquake

The infamous Niigata earthquake occured on June 16, 1964. It had a magnitude of 7.5 and caused 36 deaths and 385 injuries. Although this earthquake affected a large portion of Japan, the Niigata Prefecture had the largest infrastructure damage. Thus, this paper will focus on this particular prefecture. One very characteristic thing about Niigata was that this was the first time that an earthquake titled or overturned many buildings. What was even more unique was that many of the affected buildings had no damage to their superstructure!
Liquefaction Explained
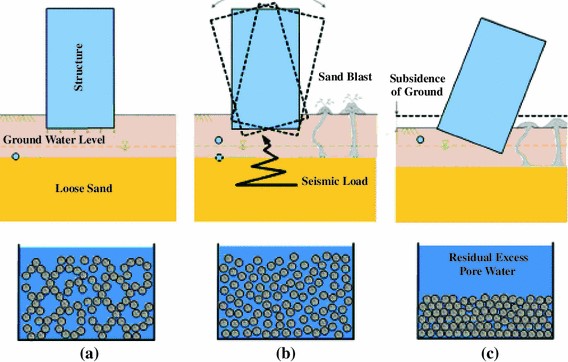
Liquefaction occurs when there is a rapid increase in pore pressures which triggers a large decrease in effective stress. As a result, the soil loses most of its shearing resistance and behaves like a liquid (Johansson). During earthquake shaking, loose saturated sand tries to become denser by reconfiguring particles more tightly, but during this quick transition, there is not enough time for water to move out. This causes water pressure to build up within the pores of the soil and thus liquefaction occurs. This is what happened during the historical 1964 Niigata Earthquake.
Tests for Liquefaction Mechanisms
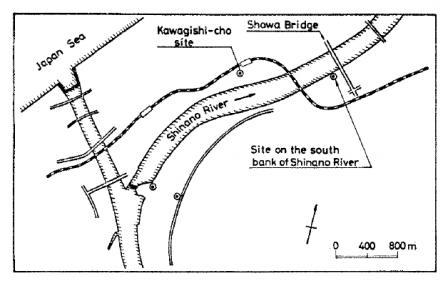
A study by Kenji Ishihara took soil samples from two different sites that were near the Niigata City acceleration recording station; one had experienced significant liquefaction and the other one was relatively undisturbed. Both sites were located near the Shinano river. The Southbank site, which experienced no ground damage or structure tilting, is composed of shallow dense sand deposits. The second site, Kawagishi-cho, was composed of non-engineered fill that had not been compacted. Buildings at this site settled more than 50 cm and had experienced drastic tilting.
The standard penetration test from the Kawagishi-cho site showed that the soil was composed of a 20 meter thick layer of clean sand deposits. As seen in Figure 4, the first 11 meters were made up of medium sand and the layer from 11m to 20m depth consisted of medium fine sand. On the other hand, the SPT at the Southbank site showed a more diverse soil profile ranging from medium sand, silt with sand, peat, less than 2 meters of medium fine sand, about 9 meters of fine sand and a thin layer of medium sand (Figure 5). Since the sand past 5 meters was too dense, no samples beyond this depth were obtained. This showed that the Osterberg Piston sampler could be used on loose to medium sand only when the blow count was below 20. The results found that the blow count of the Standard Penetration Test and the penetration resistance of the Cone Penetration Test followed the same pattern with depth. This is to say that a higher blow count was associated with a higher tip resistance value.


In order to find the liquefaction potential or cyclic strength of the soils, cyclic triaxial tests were performed. These tests measure the soil’s ability to resist shear stresses when subjected to a cyclic loading such as an earthquake (geotechdata). The cyclic stress ratio is the deviator stress divided by twice the effective consolidation stress. Figures 6,7 and 8 are cyclic triaxial test strength curves where the cyclic stress ratio is plotted against the number of cycles. The factor of safety can then be calculated by dividing the cyclic strength by the cyclic stress ratio. The cyclic stress ratio was found from acceleration data. All this data was used to see how the factor of safety of the soil changes with depth. Locations with a factor of safety below 1 indicate that it is likely that the soil at that layer liquefied. The Kawagishi-cho site had a factor of safety below 1 from about 5m to 11m. This is roughly a 6m thick layer of liquified soil. The South Bank Site results show that the factor of safety was below 1 at a depth of 4.5 meters. However, this site did not experience any liquefaction damage above the ground surface. A reasonable conclusion for that is that the thickness of the liquefied layer influences whether there will be liquefaction damage at the surface.

Damage Distribution
Another study zoomed out and took soil samples from all over Niigata city in order to understand the differences in soil conditions within different zones of damage (Ohsaki). Damage was defined as follows:
Little or No Damage: angle of tilt between 0° and 1°
Small Damage: angle of tilt between 1° and 2.5°
Heavy Damage: angle of tilt > 2.5°

Figure 9 above shows the distribution of angles of tilt. Figure 10 shows the zones of damage that became apparent after plotting the data in Figure 9.
Zone A: Little or No Damage
Zone B: Small Damage
Zone C: Heavy Damage
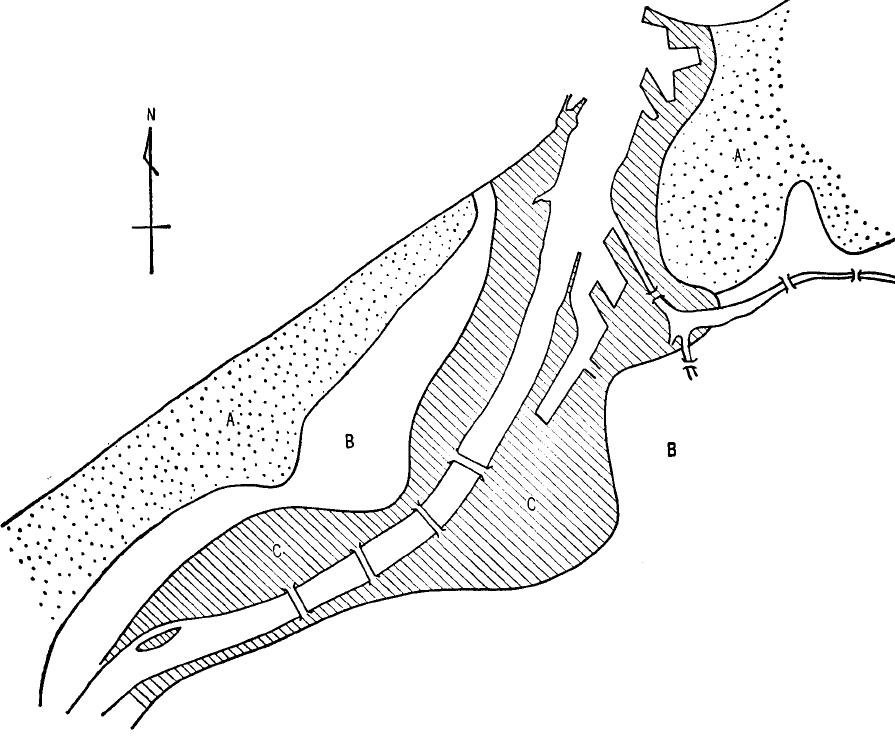
Finding the difference between the soil in Zone B and Zone C may be a clue as to why one section had their buildings overturned and the other section didn’t. Table 1 shows that the blow count for Zone C from layers 5m-10m was significantly lower than the blow counts for Zone B. Although there is also a notable difference from 10m - 15m, it is not as significant as the layer above. This is an indication that the low N-values in Zone C may have been a factor of the heavy damage.

In order to assess this further, Ohsaki's study compared blow counts of soil samples before and after the earthquake. Low blow counts are associated with loose soil and higher blow counts are representative of denser soils. From Figure 11, it seems that after the earthquake the initially loose sand was compacted and the initially dense sand was loosened. This means that there must be an N-value at which there’s no volume change. The void ratio at this moment is the “critical void ratio for vibration” (Koizumi). This allowed for the curve of critical N-value in Figure 12. This is significant because if a soil’s measured N-value is below that critical N at that depth, then the volume will contract which will drastically increase pore water pressure. This results in a virtually no effective stress and the sand behaves like a liquid.


Now that we know all this, we can find the relationship between the Critical N value and the tilting of buildings. If the average depth of the footing base is about 8 meters, then from the Critical N graph (Figure 12) we see that the Critical blow count at a depth of 8m would be 12. So now all we have to do is find the measured N of the 40 samples at a depth of 8m. If the blow count is below, then that area was susceptible to liquefaction and may result in tilting of buildings. This give us Figure 13 which for the most part agrees with the damage. However, after using contour lines to plot the “lower limits of the liquefaction zone,” an important finding was that damage at the surface (overturning and tilting of buildings) would only occur if the sand layer was larger than a certain limit.


Evidence for Liquefaction
There were instances of overturned and settled structures prior to Niigata but these had occurred on soft clay soil not in sand. There was no evidence of sliding or upheaval on the opposite end of the titled buildings that would indicate a different type of failure. The buildings were simply subsided and titled. So after considering the various test data and the physical evidence onsite, the most reasonable explanation was that soil did in fact behave like liquid. The heavy structures sank into the soil and light structures like manholes floated up to the surface thus leaving no trace of rotational or sliding movements.
Sand eruptions are characteristic evidence of liquefaction. Sand blows are a mixture of sand and water that shoot up into the air and may last a couple of minutes (Kawakami). Then the ground subsides and crater-like holes are left on the surface. The deposits that were ejected contain subsoil from the layer that was liquefied - non-coincidentally this would be the layer with a resistance value below the critical N value. Sand blows only happen in sandy soil with high water tables. They will not happen in cohesive soils.

Aside from sand eruptions, liquefaction of the sand induced large horizontal displacements. Factors that contributed to the displacement included “the gradient of the ground surface, the gradient of the bottom of the liquefied layer and the thickness of the liquefied layer” (Hamada/Wakamatsu). The Kawagishi-cho site experienced large displacements reaching a maximum of 9 meters. The direction of horizontal displacement was determined by the inclination of the liquefied layer and the ground surface. If the ground surface was relatively flat but the liquefied layer was angled, then the direction of displacement would be determined by that slope.


Techniques Developed in response to Liquefaction
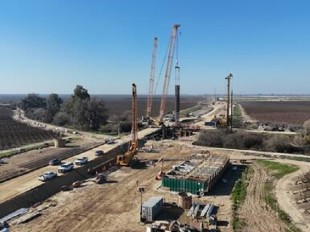
Although most engineering research was oriented towards identifying the susceptibility of soils to liquefaction, soil improvement techniques were also developed. There are two different classes of methods: techniques to strengthen structures and ground improvement techniques to prevent liquefaction. Currently, there are six types of soil improvement: compaction, solidification, replacement, groundwater lowering, drainage, and shear deformation control (Yasada, 2014). Compaction as a liquefaction countermeasure was a direct result of the 1964 Niigata Earthquake. Researchers found that oil tanks that didn't settle were placed on soil that had been compacted using vibro-flotation. Vibro-flotation requires lowering a vibrating probe into granular soil in order to densify the particles. To prevent liquefaction, the “probe is raised and lowered in a grid pattern.” The other 5 techniques were developed and improved in the decades after Niigata, but were not direct results of this earthquake.

References
Berkeley, U. (2008, September 24). Seismo Blog. Retrieved December 01, 2020, from https://seismo.berkeley.edu/blog/2008/09/24/when-the-ground-gives-way.html
Geotech data (2019). Cyclic Triaxial Test. Retrieved December 01, 2020, from http://www.geotesting.org/geotest/cyclic-triaxial-test
Guo, J. (2000, October 01). 2000: Niigata (Kawagishi-cho) Apartment Buildings. Retrieved December 01, 2020, from https://buildingfailures.wordpress.com/2000/10/01/niigata-kawagishi-cho-apartment-buildings/
Hamada, Masanori; Wakamatsu, Kazue; and Yasuda, Susumu, "Liquefaction Induced Permanent Ground Displacement in Niigata City" (1991). International Conferences on Recent Advances in Geotechnical Earthquake Engineering and Soil Dynamics. 33. https://scholarsmine.mst.edu/icrageesd/02icrageesd/session03/33
Ishihara, K., & Koga, Y. (1977). CASE STUDIES OF LIQUEFACTION IN THE 1964 NIIGATA EARTHQUAKE. Soils and Foundations, 21(3), 35-52. doi:https://doi.org/10.3208/sandf1972.21.3_35
Ishihara, K., & Yoshimine, M. (1992). EVALUATION OF SETTLEMENTS IN SAND DEPOSITS FOLLOWING LIQUEFACTION DURING EARTHQUAKES. Soils and Foundation, 32(1), 173-188. doi:https://doi.org/10.3208/sandf1972.32.173
Johansson, J. (2000, January 27). Soil Liquefaction Website. Retrieved December 01, 2020, from https://depts.washington.edu/liquefy/html/main.html
Kawakami, F., & Asada, A. (1966). DAMAGE TO THE GROUND AND EARTH STRUCTURES BY THE NIIGATA EARTHQUAKE OF JUNE 16, 1964. Soils and Foundations, 6(1), 14-30. doi:https://doi.org/10.3208/sandf1960.6.14
K. Harada; S. Yasuda (2014), "MEASURES DEVELOPED IN JAPAN AFTER THE 1964 NIIGATA EARTHQUAKE TO COUNTER THE LIQUEFACTION OF SOIL," https://datacenterhub.org/resources/13195.
Koizumi, Y. (1966). CHANGES IN DENSITY OF SAND SUBSOIL CAUSED BY THE NIIGATA EARTHQUAKE. Soils and Foundations, 6(2), 38-34. doi:https://doi.org/10.3208/sandf1960.6.2_38
Ohsaki, Y. (1966). NIIGATA EARTHQUAKES, 1964 BUILDING DAMAGE AND SOIL CONDITION. Soils and Foundations, 6(2), 14-37. doi:https://doi.org/10.3208/sandf1960.6.2_14
“ Scheme of the Differential Settlement of the Structure Due to the Foundation Soil Liquefaction.” Geotech, www.geotech.hr/en/soil-liquefaction/
Yamada, G. (1966). DAMAGE TO EARTH STRUCTURES AND FOUNDATIONS BY THE NIIGATA EARTHQUAKE JUNE 16, 1964, IN JNR. Soils and Foundations, 6(1), 1-13. doi:https://doi.org/10.3208/sandf1960.6.1
Yoshimi, Y., & Tokimatsu, K. (1977). SETTLEMENT OF BUILDINGS ON SATURATED SAND DURING EARTHQUAKES. Soils and Foundations, 17(1), 23-38. doi:https://doi.org/10.3208/sandf1972.17.23
Presentation
Industry News


Events

19th European Conference on Soil Mechanics and Geotechnical Engineering, Istanbul, Türkiye
The 10th International Congress on Environmental Geotechnics

11th European Conference on Numerical Methods in Geotechnical Engineering

1st International Conference on Sustainability in Geotechnical Engineering (ICSGE 2027)

International Symposium on Cone Penetration Testing (CPT'27)

Rocscience International Conference 2027: Geotechnics, Structures & Hydro in the Age of AI
IS-GI Lyon 2027: International Symposium on Ground Improvement
GeoMandu 2027, 11th AYGEC and 1st SACG: Mountain Geotechnics for Infrastructure Development

Colloque National sur la Géotechnique