Step-by-Step Guide for Grain Size Analysis
Grain size analysis is a typical laboratory test conducted in the soil mechanics field. The purpose of the analysis is to derive the particle size distribution of soils.
The analysis is conducted via two techniques. Sieve Grain Size Analysis is capable of determining the particles’ size ranging from 0.075 mm to 100 mm. Any categorization of grains larger than 100mm will be conducted visually whereas particles smaller than 0.075 mm can be distributed using the Hydrometer Method.
Sieve Grain Size Analysis
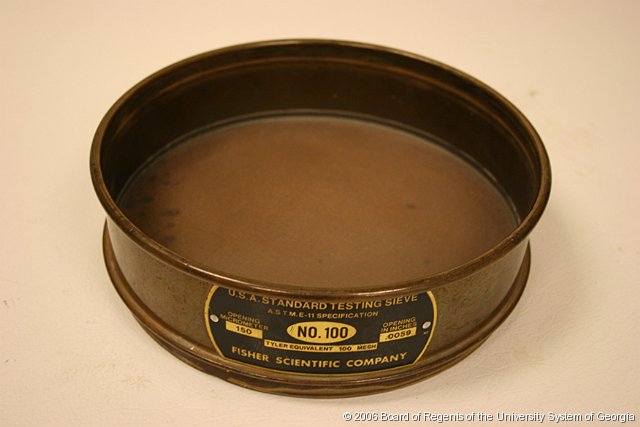
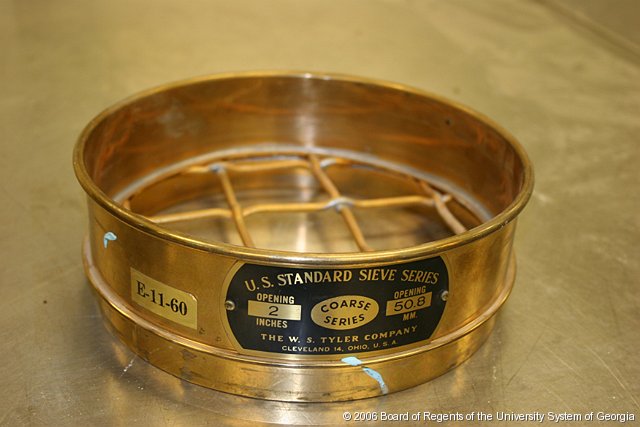
The test is carried out with the utilization of a set of sieves with different mesh sizes. Each sieve has squared shaped openings of a certain size. The sieve separates larger from smaller particles, distributing the soil sample in 2 quantities. The grains with diameters larger than the size of the openings are retained by the sieve, while smaller diameter grains pass through the sieve. The test is conducted by placing a series of sieves with progressively smaller mesh sizes on top of each other and passing the soil sample through the stacked sieve “tower”. Therefore, the soil particles are distributed as they are retained by the different sieves. A pan is also used to collect those particles that pass through the last sieve (No. 200).
The nomenclature of the sieves typically used for Grain Size Analysis of soils as well as the corresponding opening sizes are presented in Table 1. Based on the range of the particle sizes, and the Unified Soil Classification System (USCS), soils can be classified in the generic categories presented in Table 2. Further categorizations are possible upon further analysis of the Grain Size Distribution results.
Table 1: The sieves typically utilized in the Grain Size Analysis test

Table 2: Soil classification based on particle size range (USCS)

Test Set-up Components
A typical Sieve Analysis test set-up is composed of:
- Drying oven maintained at 110 ± 5°C
- Standard sieves
- Sample splitter
- Mechanical sieve shaker
- Pans
A typical set-up of stacked sieves placed on a mechanical sieve shaker is shown in Figure 1.
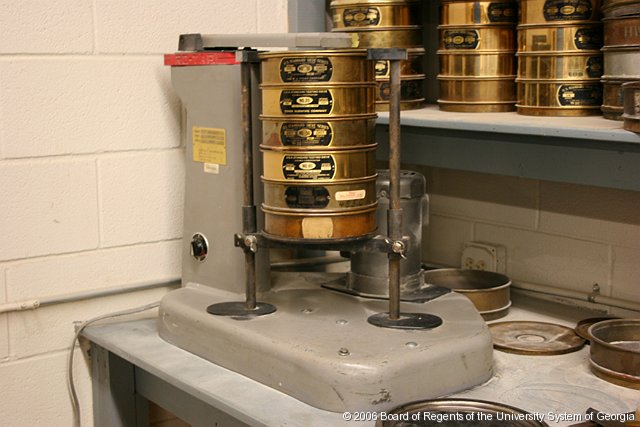
Figure 1: Typical set-up of stacked sieves on mechanical shaker (Credits: Prof. Susan Burns, Georgia Tech University, Department of Civil and Environmental Engineering)
Step-by-Step Sieve Analysis Test Procedure
The typical testing procedure consists of the following steps:
- Weigh a dry soil sample which should be at least 500gr.
- Record the weight of the sieves and the pan that will be utilized during the analysis. Each sieve should be thoroughly cleaned up before the test.
- Assemble the sieves in ascending order, placing those with the larger openings on top. Therefore, the No. 4 sieve should be on top and the No. 200 sieve on the bottom of the stack.
- Place the soil sample into the top sieve and place a cap/lid over it.
- Place the stack in a mechanical shaker and shake for 10 minutes
- Remove the sieve stack from the shaker and measure the weight of each sieve and that of the pan placed at the bottom of the stack.
Data Manipulation
The weight of the soil retained on each sieve is calculated by subtracting the weight of the empty sieve from the recorded weight of the sieve after the test. The total weights of particles retained are added and compared to the initial weight of the soil sample. A difference lower than 2% is required.
The percentage retained on each sieve is determined by dividing each weight retained by the initial weight of the soil sample. Subsequently, the total percentage passing from each sieve is calculated by subtracting the cumulative percentage retained in that particular sieve and the ones above it from totality.
A typical Grain Size Analysis data sheet is presented below (Table 3). Moreover, a typical grain size distribution curve of a medium sand is shown in Figure 2.
Table 3: Typical Grain Size Analysis data sheet

The Uniformity Coefficient (Cu)
The uniformity coefficient (Cu) expresses the variety in particle sizes of soil and is defined as the ratio of D60 to D10 (Figure 1). The value D60 is the grain diameter at which 60% of soil particles are finer and 40% of soil particles are coarser, while D10 is the grain diameter at which 10% of particles are finer and 90% of the particles are coarser. Therefore, Cu is estimated as:

When Cu is greater than 4, the soil is classified as well graded, whereas when Cu is less than 4 the soil is classified as poorly graded/uniformly graded.

Figure 2: Grain Size Distribution curve of a medium-fine sand
Hydrometer Grain Size Analysis
The hydrometer analysis is utilized for particle sizes finer than 75 μm. These particles pass through the last sieve (No. 200) of the Sieve Analysis.
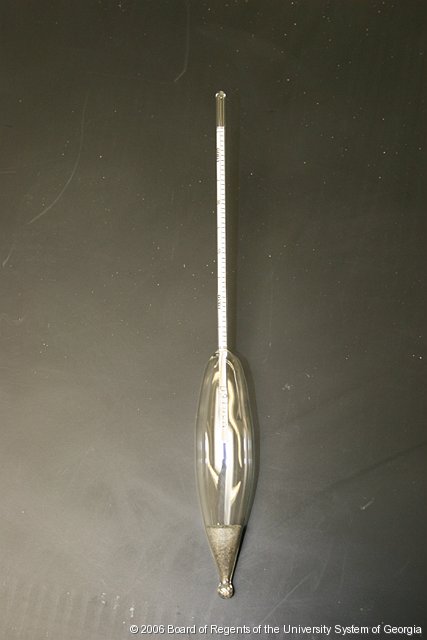
A hydrometer is a device designed to measure the relative density of a liquid which refers to the ratio of the actual density of the substance to the density of the water. The apparatus consists of a cylindrical stem and a bulb that contains a specific portion of mercury or lead at the bottom, calibrated to float upright in the liquid. The liquid is poured in a tall cylinder usually made out of glass and the hydrometer is placed inside until it is stabilized. The test is based on the principle that in a low-density liquid, the hydrometer will sink deeper until it balances.
The hydrometer contains a scale which is used to record the relative density of the liquid based on its submersion.
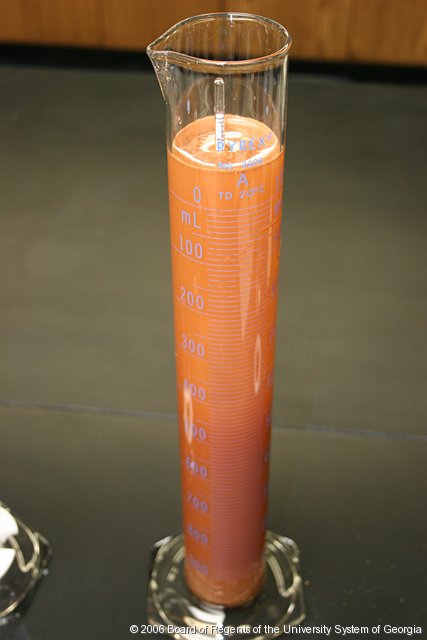
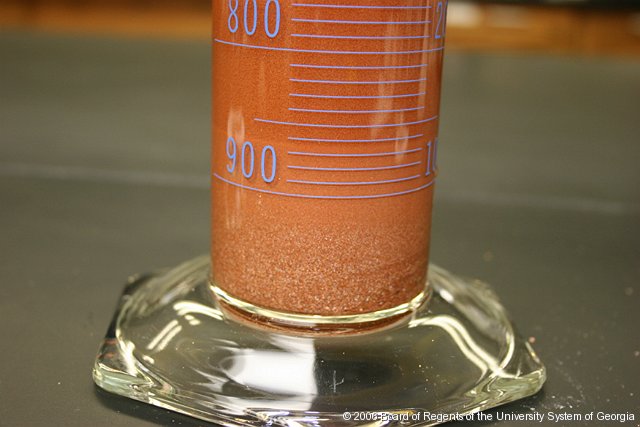
The hydrometer grain size analysis takes advantage of the change in the relative density of a soil-water mixture as the soil particles sink. The test relies on the fact that when the soil is poured in the liquid, the relative density of the soil-water mixture will rise. As the soil particles sink the density decreases until it reaches the initial density of the liquid. The heaviest particles (larger in diameter) will sink first.
Test Set-up Components
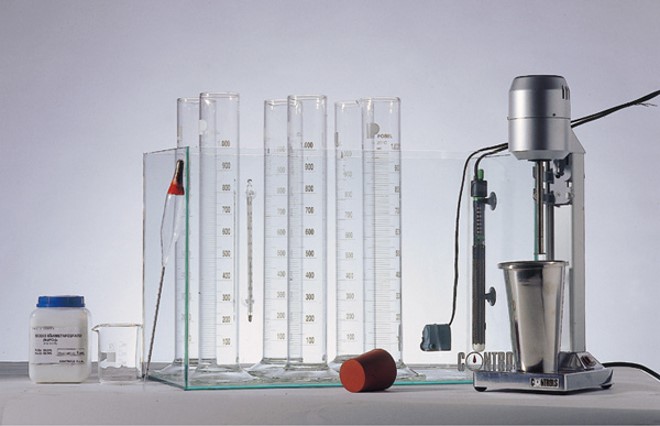
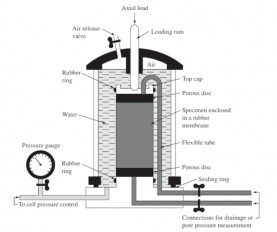
A typical Hydrometer test set-up, shown in Figure 3, is composed of:
- Hydrometer device
- Drying oven maintained at 110 ± 5°C
- Stirring apparatus
- 2 glass containers, each of 1000 ml volume
- Mercury thermometer ranging from 0–104 °C
- Dispersing agent
- Desiccator
- Stopwatch
- Distilled water

Figure 3: Hydrometer Test set-up by Controls Group (for more information click here)
Step-by-Step Hydrometer Test Procedure
The typical testing procedure consists of the following steps:
- Sieve enough soil by hand through the #40 sieve
- Dry soil at 110 ± 5° C overnight
- Utilize a desiccator to place the sample and allow it to cool.
- Record the dry weigh of the soil (typically, 50 gr)
- Place 500-600 ml of distilled water in a steel mixing cup.
- Add 5gr of sodium hexametaphosphate solution and utilize a high-speed mixer to disperse it (~3 min.).
- Add the soil to the mixture and mix for 5-6 minutes.
- Clean the blade as no material should be lost.
- Place the mixture in a 1-liter cylindrical container and fill it with distilled water.
- Place a rubber cap on top of the cylinder and turn the container upside down multiple times.
- Right after shaking, place the container on top of a table and start measuring time.
- Slowly insert the hydrometer device into the container and take readings at 10, 20, 40, 60 and 120 seconds, respectively. The measurement should be taken at the top of the formed meniscus. Utilize a thermometer to measure the temperature.
- Right after the 2 minutes reading, remove the hydrometer and place it into another container with distilled water.
- Carefully insert the hydrometer and take subsequent measurements at 4, 6, 8, 15, 30, 60 and 90 minutes. Between readings, place the rubber cap on top of the container.
Hydrometer Grain Size Analysis Calculations
If the temperature throughout the hydrometer test remains constant, the Stoke’s Law can be utilized to derive the diameter of the particles.
The formula of Stoke’s Law is presented below:
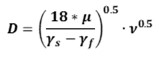
where:
D: The maximum diameter of soil particles corresponding to the percentages indicated by a single hydrometer test reading.
μ: The fluid’s viscosity
v: the terminal velocity of settlement
γs: The unit weight of soil particles
γf: The unit weight of the fluid
Because the fluid’s viscosity, the unit weight of soil particles and the unit weight of the fluid depend only on the temperature and the specific gravity of the soil particles, GS (typical value ~ GS=2.70), the first term of the equation is substituted by a constant known as Sedimentation constant K.
Therefore, Stoke’s Law is simplified as following:

The terminal velocity of the particles (v, in cm/min) is calculated by dividing the sedimentation depth L (the distance from the surface of the suspension to the center of volume of the hydrometer, in cm) by time (t, in min).
Therefore, Stoke’s Law is re-written as (D in mm):
For a given hydrometer and cylindrical container, L values vary according to the hydrometer readings:
Where R is the hydrometer reading in grams/liter.
The Stoke’s law calculates the larger possibly diameter of the particles that are in suspension.
To derive the particles’ percentage passing for each reading stage the following equation is utilized:
where:
- α: correction factor for particle density
- W: weight of the original dry soil (typically, 50 gr)
- b: correction factor associated with temperature and 1 is added to eliminate the meniscus effect.
Finally, the cumulative particle percentage passing is plotted versus the maximum Diameter of the soil particles on a semi-logarithmic scale.
Stoke’s Law Assumptions
The assumptions that are made using Stoke’s Law in the hydrometer test are the following:
- The particles are much larger than the molecules of water.
- The particles are represented by smooth and rigid spheres with the same specific gravity.
- The particles settle individually and they are not affected by collisions with other particles.
- At time zero, the particles are at rest but instantly accelerate to their terminal settlement velocity
Literature
Geotechnical Test Method: Test Method and Discussion for the Particle Size Analysis of Soils by Hydrometer Method (2015). Geotechnical Engineering Bureau. Department of Transportation. State of New York. GTM-13, Revision 2
Image Gallery


Media
- Webcast on hydrometer lab test for soil particle size distribution
- Credits: William A Kitch, Professor and Chair, Department of Engineering Angelo State University
- Webcast on sieve analysis for grain size distribution
- Credits: William A Kitch, Professor and Chair, Department of Engineering Angelo State University
Want to read more like this?

SO-Sieve
Jun, 15, 2023 | SoftwareWinSieve
Dec, 12, 2013 | Software
GGU-SIEVE
Jan, 14, 2015 | Software
Soil Compaction Test
Apr, 30, 2020 | EducationIntroduction Compaction of soils is a procedure in which a soil sustains mechanical stress and i...
Soil as a three-phase System
May, 30, 2019 | EducationSoil deposits consist of the soil particles and the void space between the particles. Soil mass is...

Soil Consolidation and Oedometer Test
May, 07, 2020 | EducationWhat is Soil Consolidation? Soil Consolidation refers to the process in which the volume of a satu...

Measurement of Specific Gravity of Soils
Jul, 15, 2020 | EducationIntroduction Soil is a three-phase material that consists of solid particles and voids which are fi...
Laboratory Testing
Apr, 21, 2020 | EducationLaboratory testing is an integral part of geotechnical engineering research and practice. A well...
Discrete Element
Jul, 04, 2025 | EducationIntroduction The Discrete Element Method (DEM) is a numerical technique used to simulate the behavi...
On This Day

Related Video

Trending
Angle of Internal Friction

Slope Stability: Introduction to the Method of Slices

Exploring the World’s 10 Tallest Dams

Splitting Tensile Strength Test (Brazilian)
7.5. Example Problems
Triaxial Test

Bearing Capacity of Pile Foundations: Calculation Methods for Qs