Orica Digital Solutions Geosolutions' Unlocking operational insights for subsurface injection and production with InSAR data begins on Jul 21st 2026
Orica Digital Solutions Geosolutions' Unlocking operational insights for subsurface injection and production with InSAR data begins on Jul 21st 2026
Create a free account and view content that fits your specific interests in geotechnical engineering Learn More

PileGroup is a finite-element based program which has been developed to calculate the deformations and loads of pile groups subject to general three-dimensional loadings such as axial and lateral forces and moments applied on the pile caps.
Download Documentation Complete Feature List:
The individual piles within the pile group can be vertical or on a batter with the connection between pile heads and pile cap to be fixed, pinned or elastically restrained by rotational springs.
The pile cap behaves as a rigid body with displacement and rotation in any direction.
Nonlinear response of soils and rocks such as p-y curves for lateral loading, t-z and q-w curves for axial loading and t-θ curves for torsional loading are automatically generated by the program. The behaviour of each pile under six components of loadings (forces and moments) is solved with an improved iterative approach to satisfy the equations of equilibrium, which results in the compatibility of geometry and equilibrium of forces between the applied external loads and the reactions of each pile head.
The external loadings (vertical loads Fy, horizontal loads Fx and Fz, rotational moment My, bending moments Mx and Mz) can be applied at any position on the pile cap and multiple sets of loadings can be specified by the users. The program will automatically calculate the equivalent loading at the origin in the analysis.
P-y curves can be internally generated for a wide range of soils and rocks such as API soft clay, stiff clay with free water, stiff clay without free water, modified stiff clay with initial stiffness, Reese Sand, API sand, liquefied sand, strong rock, Reese weak rock, massive rock, elastic-plastic model and elastic subgrade model.
Various section types are available in PileGroup program and these include circular section, rectangular section, octagonal section, H-section, pipe section and user-defined section. The program considers the pile installation type as either driven or bored in the analysis to account for different approaches to estimate pile settlement under axial loading.
Nonlinear p-y curves generated internally by the program can be displayed and printed at any node point for any one pile within the pile group along the pile length for reviews or references.
Reduction factors for p-y curves are automatically determined by the program to account for pile-soil-pile interaction for closely-spaced piles based on the pile cap movement and individual pile positions within the group. In addition, PileGroup also provides other options of (1) ignore group effects (widely spaced piles, for example) and (2) user-specified group reduction factors for each pile.
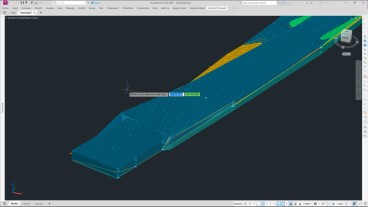
The graphical interface has been designed to enable the users to view complicated geometry in three-dimensional space. Users can display various input details of pile group analysis for any selected pile within the displayed 3-D geometry.
The program displays the amplified deformed shape of pile group under applied loads and this feature is very useful for the user to understand and interpret the analysis results.
The well-designed graphical interface allows users to easily view pile-head reactions and displacements at the pile cap.
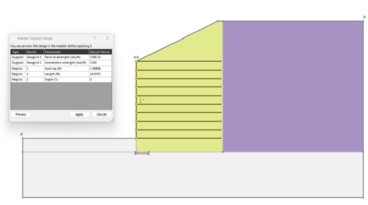
An interactive graphical input interface allows the users to easily define the soil layer geometry and pile details. Any change in the input data such as pile length, pile batter, pile head restraint types, soil layer numbers, soil layer name, soil layer thickness, soil layer colour, p-y curve model type, water table position, certain soil parameters and applied external loadings will be automatically updated in the main graphical output area. This helps the users to visually view the input change, especially for the battered piles within the pile group.
A simple soil layer and properties input interface is provided to help the users to enter the input data more easily and smoothly. The user can add, delete, insert or modify the input parameters for each soil layer by soil type.
The program provides a simple and easy approach to input pile layout for the pile group analysis. It is very straightforward for the users to enter the pile head coordinates, pile section types, pile lengths and pile batters. The users can click each pile position to display and review the relevant input properties. Three-dimensional display of the pile group on the main graphical area will be automatically updated once the input dialog is closed. This feature enables the users to review and check their inputs and therefore minimize the uncertainties in the input data.
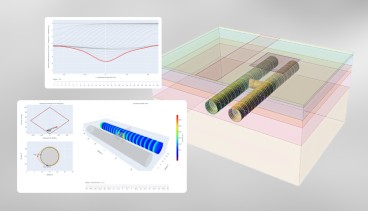
Detailed analysis results for each pile with the group such as deflection, shear force, bending moment and mobilised soil reaction are plotted against the pile length and presented in the result output dialog graphically together with the soil layer geometry. The users can view, copy and print the results for the selected pile/piles.
Axial load-settlement curves and rotational moment-rotation curves are displayed in the graphical dialog and can be viewed by the users for any pile within the group.
| Category | Deep Foundations |
| Licence Type | Commercial |
| Operating Systems | Windows XP, Windows NT, Windows 95/98, Windows 8, Windows 7 |
| Current Version | 2 |
| Release Date | 2017-10-31 00:00:00 |
| Developer | Innovative Geotechnics Pty Ltd |
| Developer Website | https://www.pilegroups.com/pilegroup |
| Developer Email | [email protected] |


This feature is only available for software listings at the Advanced or Lead Sponsorship Level. Each software provider can upgrade the sponsorship level of their software listing by visiting the sponsorship levels page.
Recommended Software

Aug, 16, 2019
GEO5 Spread Footing

Aug, 30, 2019
HeliCAP® Helical Capacity Design Software Version 3.0

Aug, 30, 2019
GEO5 Spread Footing CPT


Related Software


Developed by
Innovative Geotechnics Pty Ltd
Innovative Geotechnics Pty Ltd
News on Software
On This Day
July 20th 1837
READ MORE