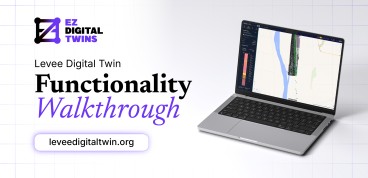
News Data Management Other Geotechnical Visualization A complete walkthrough of the Levee Digital Twin platform — an interactive tool for archiving, inspecting, and monitoring levee health, developed through a UC Berkeley research project funded by Yuba Water District, and powered by EZ Digital Twins. The platform covers two study sites — RD 784 and Dry Creek — and combines surface imagery, subsurface data (EM resistivity, boreholes), AI-based burrow detection, live sensor feeds, and 3D point clouds into a single interactive map, giving engineers and researchers a powerful way to understand levee conditions above and below ground.
00:00 – Intro
00:33 – 01: Getting Started
Opens the platform's cover page and tours the top-level controls: the Acknowledgements panel, the User Guide button (opens the full written manual), and the Tutod the map itself.
01:33 – 02: Navigating the Map
Basic map controls: pan, zoom, and the zoom buttons. Switches the basemap between Street, Topo, and Satellite. Points out the coordinate readout at the bottom of the map (geographic or UTM). Enables 3D terrain in the 2D view so layers drape over real elevation. Shows the navigation controls explainer, then walks through the viewport buttons — 2D, 3D, H (horizontal split), V (vertical split), and PIP (picture-in-picture) — and demonstrates orbit / tilt / zoom in the 3D view.
02:56 – 03: Working with Layers
Opens the Layers tab and covers all six layer groups: Photos, Raster, Vector, Subsurface, Point clouds, and Live sensors. Demonstrates raster blending by overlaying multispectral and thermal aerials with an opacity slider, geolocated field photos, borehole stratigraphy, and the EM resistivity subsurface data as both a mapped layer and a full 3D point cloud. Shows how the platform visualizes AI outputs, a Convolutional Neural Network developed by the UC Berkeley team detects animal burrows, with Jan 2025 and Feb 2025 results overlaid on the imagery to check propagation and accuracy. Closes on the difference between 2D and 3D behavior for point clouds, in 2D you see a footprint polygon that opens the 3D viewer; in 3D you see the actual cloud.
06:00 – 04: The 3D Point Cloud Viewer
The longest chapter and the technical highlight. Opens a point cloud in the dedicated 3D viewer and walks through everything: loading and toggling multiple clouds, Earth vs Orbit navigation modes, EDL depth shading, Color By modes (elevation, intensity, classification, and more), and the measurement toolset — distance, height, area, angle, and clip. The centerpiece is the height profile tool with two clouds loaded at once: surface photogrammetry from January 2025 stacked with the EM resistivity subsurface cloud, sliced across the levee in a single cross-section window. Watching the ground surface and the subsurface resistivity in the same slice is the platform's standout capability. Also demonstrates the volume tool and the clip tool for isolating a region.
08:09 – 05: Measuring and Exporting
Back on the main 2D map. Quick measurement tools — distance and area in metric and feet, and a point tool that reads out coordinates (geographic or UTM). Then the Export panel: build a titled map layout of the current view and save it as PNG or PDF.
08:47 – 06: Live Sensor Monitoring
The platform isn't just past data — it also carries current data from field sensors. The Live tab has two sections: Sensors and Cameras. Piezometer charts plot pore pressure, groundwater level, and temperature over adjustable time ranges (24h, 7d, 30d, 1Y, All), with a Compare mode to overlay two sensors. Explains the sensor status legend on the map (Normal, Warning, Alert, Offline, No data) and how alerts surface in the Alerts tab. The Cameras section covers the fixed monitoring points on the levee — not a photo gallery, but a specific section watched over time — with date/hour navigation, First/Latest/Play controls, and full-screen viewing.
11:02 – Wrap-up
Recap of what was covered and a pointer to the User Guide for more detail. Notes that the EZ Digital Twins platform is dataset-agnostic and expandable, credits the UC Berkeley research project and Yuba Water funding, and closes on EZ Digital Twins as the platform that makes geospatial digital twins like this one possible.
_______________________________________________
🔗 LINKS
Levee Digital Twin Platform: http://www.leveedigitaltwin.org/
EZ Digital Twins Socials
Website: http://www.ezdigitaltwins.com/
GeoWorld: http://www.mygeoworld.com/company/ez-digital-twins
Facebook: http://www.facebook.com/ezdigitaltwins
X/Twitter: https://x.com/EZDigitalTwins
Instagram: http://www.instagram.com/ezdigitaltwins/
LinkedIn: http://www.linkedin.com/company/ez-digital-twins
#gis #geospatial #infrastructuremonitoring #pointcloud #digitaltwin #infrastructure #monitoring #levee #ucberkeley Show more